
Figures & data
Figure 1. Identification of miR-15b-5p and PPM1D as study objects. (a) Venn diagram showing the intersection between the TRPM2-AS target miRNAs predicted via the ENCORI starBase (http://starbase.sysu.edu.cn) and the differentially expressed miRNAs of the GSE65071 data series with the criteria of adjusted P < 0.05 and log FC < −1. FC: fold change. (b) Venn diagram showing the intersection between the target miR-15b-5p mRNAs predicted via TargetScan Human 7.2 (http://targetscan.org/vert_72) and the differentially expressed mRNAs of the GSE11416 data series with the criteria of adjusted P < 0.05 and log FC > 1.5. (c) Bar graph showing the enriched KEGG pathways that the intersected genes in Figure 1(b) were involved in. (d) TRPM2-AS expression in osteosarcoma and corresponding non-tumor tissues derived from 18 OS patients, as measured via RT-qPCR. (e) TRPM2-AS expression in osteosarcoma cell lines (HOS, U2OS, Saos-2, and SJSA-1) and human normal osteoblast cell line (hFOB1.19), as measured via RT-qPCR. GAPDH served as a control. The relative target gene level was calculated by normalizing them to GAPDH in each group to its corresponding value in the hFOB1.19 group. **P < 0.001 compared with the hFOB1.19 cells. (f) Intracellular distribution of TRPM2-AS in HOS and SJSA-1 cells, determined by detecting the nuclear and cytoplasmic TRPM2-AS expression via RT-qPCR. Data are represented as the mean ± SD. All cellular experiments were performed in triplicates.
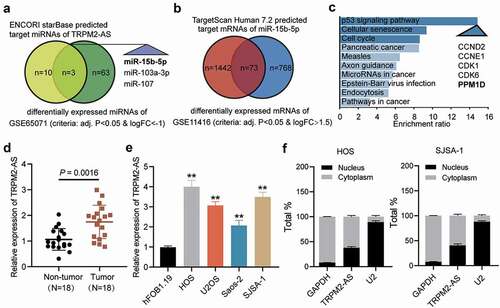
Figure 2. TRPM2-AS facilitates osteosarcoma cell proliferation and migration. (a) TRPM2-AS expression level in HOS and SJSA-1 cells with TRPM2-AS overexpression (TRPM2-AS-OE) and TRPM2-AS knockdown (sh-TRPM2-AS), as detected via qRT-PCR. GAPDH served as a control. The relative target gene level was calculated by normalizing them to GAPDH in each group to its corresponding value in the blank group. (b) The viability of HOS and SJSA-1 cells was detected at 0, 24, 48, and 72 h using a CCK-8 assay. (c) The proliferation of HOS and SJSA-1 cells was detected using a BrdU assay. Statistical data were obtained by normalizing the original OD value in each group to those in the blank group. (d) Cell migration ability of HOS and SJSA-1 cells was detected using a wound healing assay. The migration rate was calculated as follows: (Width0h – Width24h)/ Width0h × 100%. Width: the mean wound width. (a–d) Cells were transfected with TRPM2-AS-OE or sh-TRPM2-AS. Blank: blank control; NC: shRNA negative control together with the pcDNA3.1 empty vector; TRPM2-AS-OE: TRPM2-AS overexpression vector; sh-TRPM2-AS: TRPM2-AS shRNA. Data are represented as the mean ± SD. All cellular experiments were performed in triplicates. *P < 0.05, **P < 0.001 compared with the blank control group.
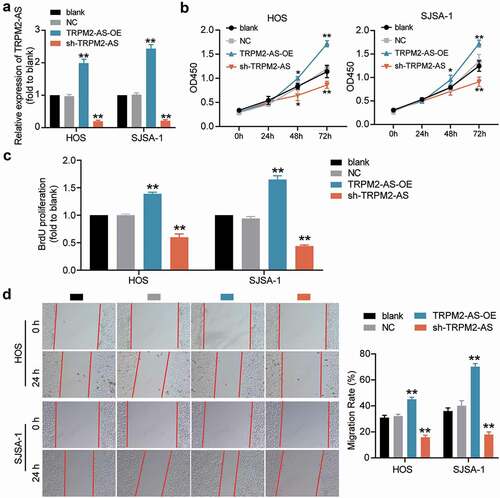
Figure 3. TRPM2-AS inhibits osteosarcoma cell apoptosis. (a) Apoptosis of HOS and SJSA-1 cells was detected using a caspase-3 activity assay. Statistical data were obtained by normalizing the original OD value in each group to its corresponding value in the blank group. (b) The relative protein level of proapoptotic proteins (Cleaved-caspase-3 and Bax) and antiapoptotic protein (Bcl-2) in HOS and SJSA-1 cells was evaluated via Western blot assay. GAPDH served as a control. The relative level of the target proteins was calculated by normalizing their relative density to GAPDH in each group to their corresponding value in the blank group. (a–b) Cells were transfected with TRPM2-AS-OE or sh-TRPM2-AS. Blank: blank control; NC: shRNA negative control together with the pcDNA3.1 empty vector; TRPM2-AS-OE: TRPM2-AS overexpression vector; sh-TRPM2-AS: TRPM2-AS shRNA. Data are represented as the mean ± SD. All cellular experiments were performed in triplicates. **P < 0.001 compared with the blank control group.
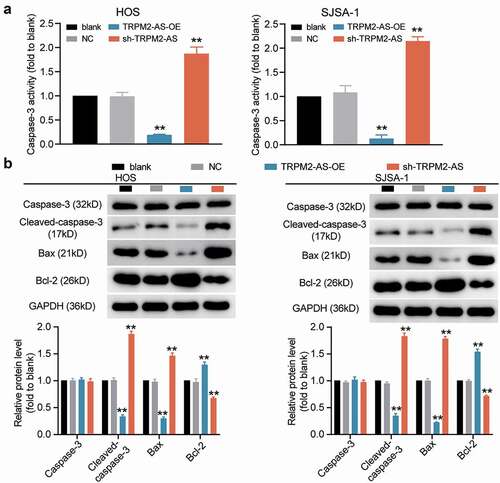
Figure 4. TRPM2-AS sponges miR-15b-5p in osteosarcoma. (a) The potential matching site between TRPM2-AS and miR-15b-5p, as predicted via ENCORI starBase. (b) Dual-luciferase reporter assay in HOS and SJSA-1 cells co-transfected with miR-15b-5p mimic or miRNA mimic-NC (miRNA-NC) and TRPM2-AS-WT (Lnc-WT) or TRPM2-AS-MUT (Lnc-MUT) reporter plasmids. **P < 0.001 compared with miRNA-NC. (c) The interaction between TRPM2-AS and miR-15b-5p in HOS and SJSA-1 cells, as evaluated via RIP analysis. **P < 0.001 compared with anti-IgG. (d) miR-15b-5p expression in osteosarcoma tissues, as detected via RT-qPCR. (e) miR-15b-5p expression in HOS and SJSA-1 cells, as detected via RT-qPCR. All cellular experiments were performed in triplicates. **P < 0.001 compared with hFOB1.19 cells. Data are represented as the mean ± SD.
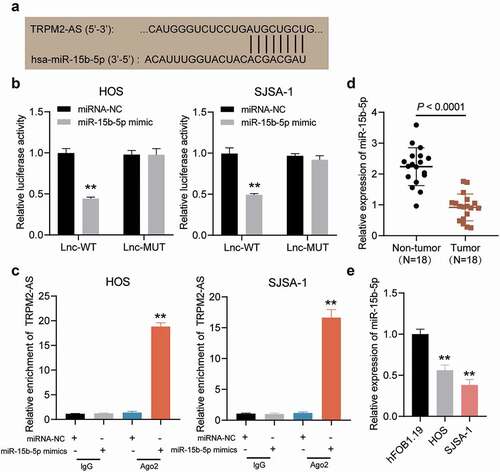
Figure 5. TRPM2-AS facilitates osteosarcoma cell proliferation and migration through the inhibition of miR-15b-5p. (a) CCK-8 assay was performed to detect OS cell viability at 0, 24, 48, and 72 h. (b) BrdU assay was used to detect cell proliferation. Statistical data were obtained by normalizing the original OD value in each group to its corresponding value in the blank group. (c) Wound healing assay was used to detect cell migration. The relative migration rate was measured using the following formula: (W0h−W24 h)/W0 h × 100%, where W represented wound width. (a-c) HOS and SJSA-1 cells were transfected with TRPM2-AS knockdown, miR-15b-5p inhibitor, TRPM2-AS knockdown plus miR-15b-5p inhibitor, or negative control. Blank: blank control; NC: shRNA negative control together with miRNA inhibitor negative control; sh-TRPM2-AS: TRPM2-AS shRNA; inhibitor: miR-15b-5p inhibitor. Data are represented as the mean ± SD. All cellular experiments were performed in triplicates. * P < 0.05, ** P < 0.001 compared with the blank control group. ## P < 0.001 compared with the sh-TRPM2-AS group.
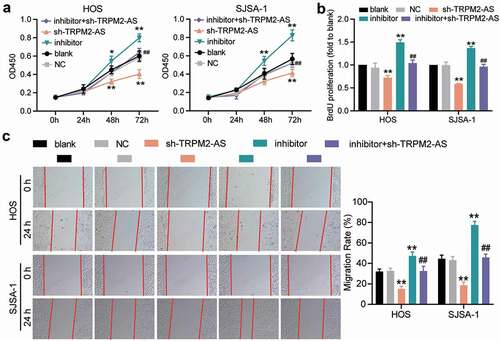
Figure 6. TRPM2-AS inhibits osteosarcoma cell apoptosis through the inhibition of miR-15b-5p. (a) Caspase-3 activity assay was used to detect cell apoptosis. Statistical data were obtained by normalizing the original OD value in each group to its corresponding value in the blank group. (b) Western blot assay was used to measure the relative protein level of proapoptotic proteins (Cleaved-caspase-3 and Bax) and antiapoptotic protein (Bcl-2) in HOS and SJSA-1 cells. GAPDH served as a control. The relative level of target proteins was calculated by normalizing their relative density to GAPDH in each group to its corresponding value in the blank group. (a-b) HOS and SJSA-1 cells were transfected with TRPM2-AS knockdown, miR-15b-5p inhibitor, TRPM2-AS knockdown plus miR-15b-5p inhibitor, or negative control. Blank: blank control; NC: shRNA negative control together with miRNA inhibitor negative control; sh-TRPM2-AS: TRPM2-AS shRNA; inhibitor: miR-15b-5p inhibitor. Data are represented as the mean ± SD. All cellular experiments were performed in triplicates. ** P < 0.001 compared with the blank control group. ## P < 0.001 compared with the sh-TRPM2-AS group.
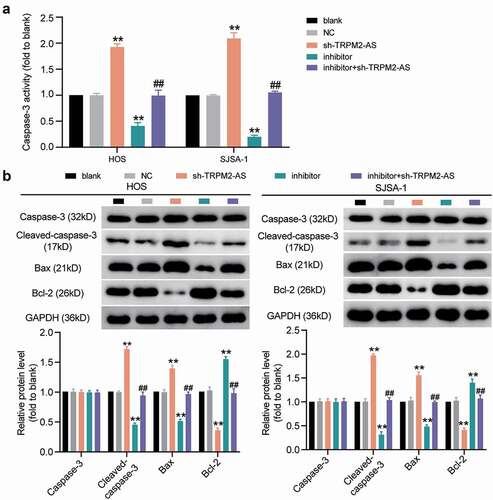
Figure 7. PPM1D is a target of miR-15b-5p in osteosarcoma cells. (a) PPM1D expression in osteosarcoma tissues and corresponding normal tissues, as detected via RT-qPCR. (b) PPM1D mRNA expression in HOS and SJSA-1 cells, as detected via RT-qPCR. ** P < 0.001 compared with hFOB1.19. (c) Detection of binding sites of miR-15b-5p and PPM1D via TargetScan. (d) Dual-luciferase reporter assay was conducted in HOS and SJSA-1 cells co-transfected with miR-15b-5p mimic or mimic NC and wild type or mutant type of PPM1D 3’-UTR luciferase reporter plasmids. ** P < 0.001 compared with miR-15b-5p mimic NC. WT: PPM1D 3’-UTR wild type; MUT: PPM1D 3’-UTR mutant type. (e) RNA pull-down assay was performed to determine the interaction between PPM1D and miR-15b-5p in HOS and SJSA-1 cells. ** P < 0.001 compared to Bio-NC. Bio-miR-15b-5p: biotin-labeled miR-15b-5p mimic; Bio-NC: biotin-labeled miRNA mimic negative control. Data are represented as the mean ± SD. All cellular experiments were performed in triplicates.
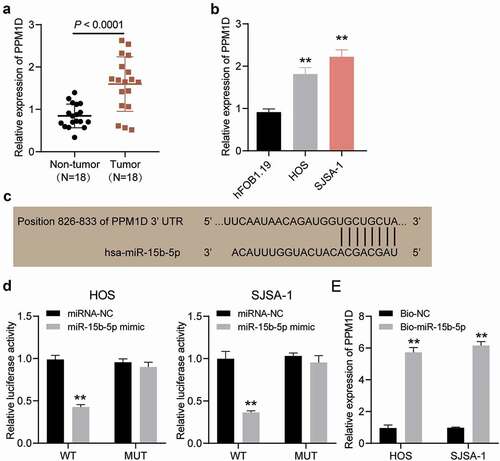
Figure 8. The promoting effect of PPM1D on osteosarcoma cell proliferation and migration is negatively regulated by miR-15b-5p. (a) The relative expression of PPM1D in HOS and SJSA-1 cells transfected with PPM1D shRNA and/or miR-15b-5p inhibitor, as determined via Western blot assay. GAPDH served as a control. The relative level of target proteins was calculated by normalizing their relative density to GAPDH in each group to their corresponding value in the blank group. (b) CCK-8 assay was performed to detect OS cell viability at 0, 24, 48, and 72 h. (c) BrdU assay was used to detect cell proliferation. Statistical data were obtained by normalizing the original OD value in each group to that in the blank group. (d) Wound healing assay was used to detect cell migration. The relative migration rate was measured using the following formula: (W0h−W24 h)/W0 h × 100%, where W represented wound width. (a-d) HOS and SJSA-1 cells were transfected with PPM1D shRNA, miR-15b-5p inhibitor, PPM1D shRNA plus miR-15b-5p inhibitor, or negative control. Blank: blank control; NC: shRNA negative control together with miRNA inhibitor negative control; sh-PPM1D: PPM1D shRNA; inhibitor: miR-15b-5p inhibitor. Data are represented as the mean ± SD. All cellular experiments were performed in triplicates. ** P < 0.001 compared with blank control group. ## P < 0.001 compared with inhibitor group.
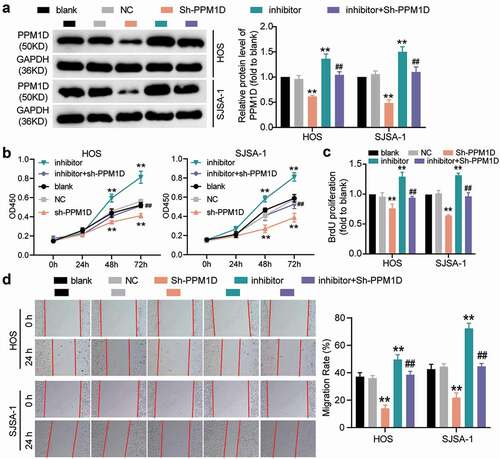
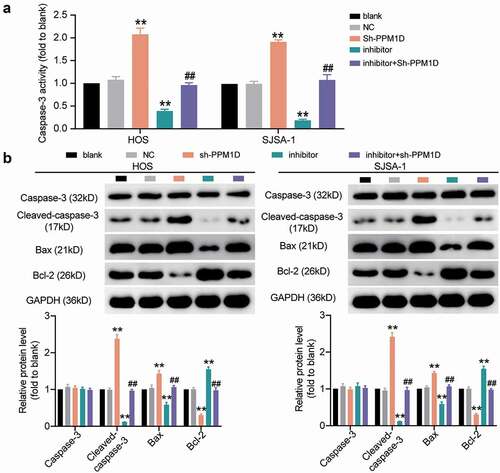
Figure 9. The negative effect of PPM1D on osteosarcoma cell apoptosis is negatively regulated by miR-15b-5p. (a) Caspase-3 activity assay was used to detect cell apoptosis. Statistical data were obtained by normalizing the original OD value in each group to its corresponding value in the blank group. (b) Western blot assay was used to measure the relative protein level of proapoptotic proteins (Cleaved-caspase-3 and Bax) and antiapoptotic protein (Bcl-2) in HOS and SJSA-1 cells. GAPDH served as a control. The relative level of target proteins was calculated by normalizing their relative density to GAPDH in each group to their corresponding value in the blank group. (a-b) HOS and SJSA-1 cells were transfected with PPM1D shRNA, miR-15b-5p inhibitor, PPM1D shRNA plus miR-15b-5p inhibitor, or negative control. Blank: blank control; NC: shRNA negative control together with miRNA inhibitor negative control; sh-PPM1D: PPM1D shRNA; inhibitor: miR-15b-5p inhibitor. Data are represented as the mean ± SD. All cellular experiments were performed in triplicates. ** P < 0.001 compared with blank control group. ## P < 0.001 compared with inhibitor group.
Supplemental Material
Download Zip (225.6 KB)Data availability statement
By intersecting the predicted target miRNAs of TRPM2-AS and the differentially expressed miRNAs of GSE65071 data series (adjusted P<0.05, log FC<-1), three miRNAs were identified. By intersecting the predicted target mRNAs of miR-15b-5p by TargetScan Human 7.2 database and the differentially expressed mRNAs of GSE11416 data series (adjusted P<0.05, log FC>1.5), 73 mRNAs were identified. We then uploaded the 73 mRNAs to WebGestalt (http://www.webgestalt.org/option.php) to enrich the terms that the 73 genes were involved. P53 signaling pathway was found to be the most significantly enriched term, and CCND2, CCNE1, CDK1, CDK6 and PPM1D out of the 73 genes were on this pathway