
Figures & data
Table 1. Correlation between clinicopathological characteristics and circ_0020123 expression level in NSCLC patients
Figure 1. The expression profile of circ_0020123 in NSCLC. (a) qRT-PCR analysis of circ_0020123 expression level in 77 paired NSCLC tissues and adjacent normal tissues. (b, c) qRT-PCR analysis of circ_0020123 expression level in NSCLC tissues based on TNM staging and lymph node metastasis. (d) qRT-PCR analysis of circ_0020123 expression level in two NSCLC cell lines (A549 and PC9) and non-cancerous lung cell line BEAS-2B. *P < 0.05.
Figure 2. Identification of circ_0020123 in NSCLC cells. (a) The information of circ_0020123. (b) Comparison of the abundance of circ_0020123 in the nuclear and cytoplasmic using qRT-PCR. (c) qRT-PCR analysis of the expression of circ_0020123 and linear PDZD8 mRNA in reverse transcription using Random and Oligo(dT)18 primers. (d, e) qRT-PCR analysis of the abundances of circ_0020123 and PDZD8 mRNA in A549 and PC9 cells after treatment with Actinomycin D for 0, 4, 8, 12 and 24 h, respectively. (f) qRT-PCR analysis of the circ_0020123 and PDZD8 mRNA in A549 and PC9 cells treated with or without RNase R. *P < 0.05.
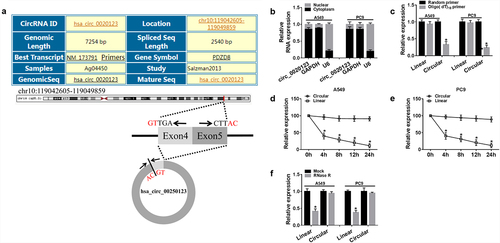
Figure 3. Effects of circ_0020123 on NSCLC tumorigenesis in vitro. A549 and PC9 cells were transfected with si-circ_0020123 or si-NC. After transfection, (a) qRT-PCR analysis of circ_0020123 expression in cells; (b, c) CCK-8 assay of cell viability at different time points of 0, 24, 48, and 72 h; (d, e) flow cytometry assay of cell cycle; (f) colony formation assay of cell proliferation; (g) cell apoptosis analysis using flow cytometry assay. *P < 0.05.
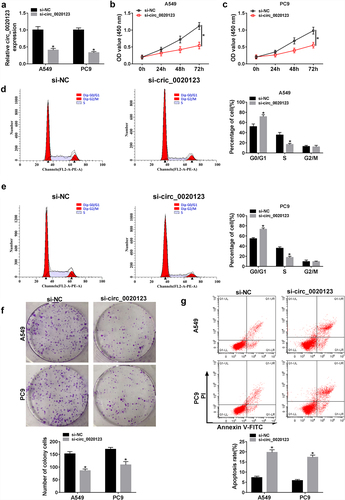
Figure 4. Effects of circ_0020123 on NSCLC tumorigenesis in vitro. (a, b) Transwell assay of cell migration and invasion in A549 and PC9 cells transfected with si-circ_0020123 or si-NC. *P < 0.05.
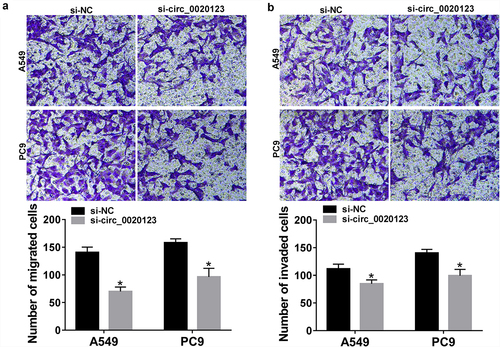
Figure 5. Circ_0020123 directly bind to miR-940. (a) Schematic illustration exhibiting the binding sites between circ_0020123 and miR-940. (b) qRT-PCR analysis of miR-940 expression in A549 and PC9 cells transfected with miR-NC or miR-940. (c, d) Luciferase activity analysis in A549 and PC9 cells co-transfected with the luciferase reporter plasmid and the indicated miRNAs using the dual-luciferase reporter assay. (e, f) The enrichment of circ_0020123 and miR-940 in the immunoprecipitated RNA of A549 and PC9 cells using anti-Ago2 or anti-IgG. (g) qRT-PCR analysis of circ_0020123 enrichment in A549 and PC9 cells with Bio-NC or Bio-miR-940. (h) qRT-PCR analysis of miR-940 in circ_0020123-silenced A549 and PC9 cells. (i, j) qRT-PCR analysis of miR-940 expression level in 77 paired NSCLC tissues and adjacent normal tissues, as well as in NSCLC cell lines (A549 and PC9) and non-cancerous lung cell line BEAS-2B. (k) The correlation between miR-940 level and circ_0020123 expression in NSCLC tissues using the Spearman test. *P < 0.05.
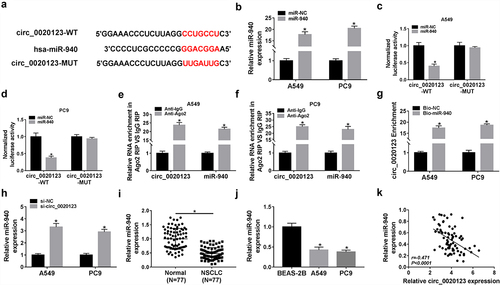
Figure 6. MiR-940 mediates the effects of circ_0020123 on NSCLC tumorigenesis. (a) qRT-PCR analysis of miR-940 expression in A549 and PC9 cells transfected with anti-miR-NC or anti-miR-940. The anti-miR-NC or anti-miR-940 was transfected into circ_0020123-silenced A549 and PC9 cells. After transfection, (b-d) cell proliferation analysis using CCK-8 assay and colony formation assay; (e-g) flow cytometry assay of cell cycle and cell apoptosis; (h, i) cell migration and invasion ability analysis using transwell assay. *P < 0.05.
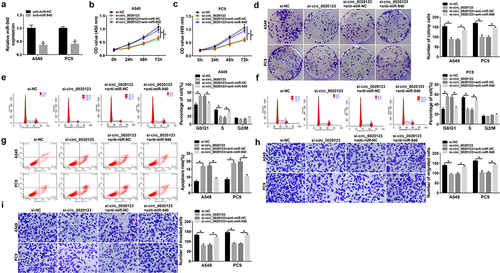
Figure 7. KIAA1522 is a target of miR-940. (a) Schematic illustration presenting the binding sites between KIAA1522 and miR-940. (b, c) Luciferase activity analysis in A549 and PC9 cells co-transfected with the luciferase reporter plasmid and miR-NC or miR-940 using the dual-luciferase reporter assay. (d, e) The enrichment of KIAA1522 and miR-940 in anti-Ago2 or anti-IgG in A549 and PC9 cells. (f, g) qRT-PCR and Western blot analysis of KIAA1522 expression in miR-940-overexpressed or miR-940-down-regulated A549 and PC9 cells. (h-k) qRT-PCR and Western blot analysis of KIAA1522 expression level in 77 paired NSCLC tissues and adjacent normal tissues, as well as in NSCLC cell lines (A549 and PC9) and non-cancerous lung cell line BEAS-2B. (l, m) The correlation between KIAA1522 expression and circ_0020123 or miR-940 level in NSCLC tissues using the Spearman test. (n, o) qRT-PCR and Western blot analysis of KIAA1522 expression in A549 and PC9 cells transfected with si-NC, si-circ_0020123, si-circ_0020123 + anti-miR-NC, or si-circ_0020123 + anti-miR-940. *P < 0.05.
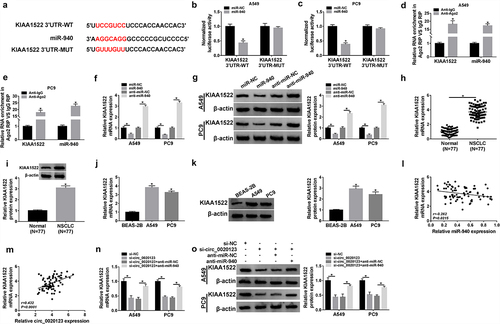
Figure 8. MiR-940 suppresses NSCLC tumorigenesis through targeting KIAA1522. (a, b) qRT-PCR and Western blot analysis of KIAA1522 expression in A549 and PC9 cells transfected with pcDNA or KIAA1522. A549 and PC9 cells were transfected with miR-NC, miR-940, miR-940 + pcDNA, or miR-940 + KIAA1522. After transfection, (c-e) cell proliferation analysis using CCK-8 assay and colony formation assay; (f-h) flow cytometry assay of cell cycle and cell apoptosis; (i, j) transwell assay of cell migration and invasion ability. *P < 0.05.
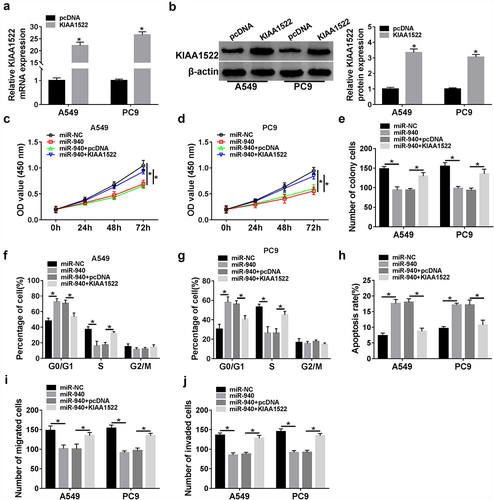
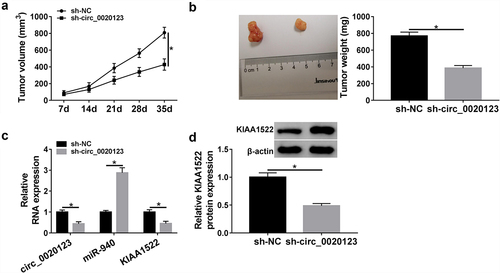
Figure 9. Circ_0020123 silencing hinders tumor growth in vivo. (a) The tumor volume was evaluated every week after 7 days postinoculation. (b) Images of tumors and tumor weight after 35 days were calculated. (c, d) qRT-PCR and Western blot analysis of circ_0020123, miR-940, and KIAA1522 expression in excised tumors. *P < 0.05.
Supplemental Material
Download Zip (3.7 MB)Data availability statement
Data sharing is not applicable to this article as no new data were created or analyzed in this study.