Figures & data
Table 1. DE lncRNAs in Stage II vs. I or Stage “III & IV” vs. I (p < 0.005)
Table 2. Relationship between LINC00649 and clinical-pathological features in TNBC
Figure 1. LINC00649 was up-regulated in TNBC and was associated with tumor prognosis (a) Venn plot for DE lncRNAs in Stage II vs. I & Stage “III&IV” vs. I. (b) QRT-PCR was used to detected the mRNA levels of LINC01287, LINC00649, LINC00887, LINC01194 and LINC01518 in the TNBC tissues and para-cancerous normal tissues from 46 TNBC patients. *P < 0.05 vs. Adjacent. (c) QRT-PCR was used to detected LINC00649 level in the MCF-10A, MCF-7, BT474, BT-549, BT-20, MDA-MB-231, MDA-MB-468 and MDA-MB-453 cells. *P < 0.05 vs. MCF-10A. (d) The LINC00649 levels in the nuclear and cytosolic fractions derived from MDA-MB-231 and BT549 cells.
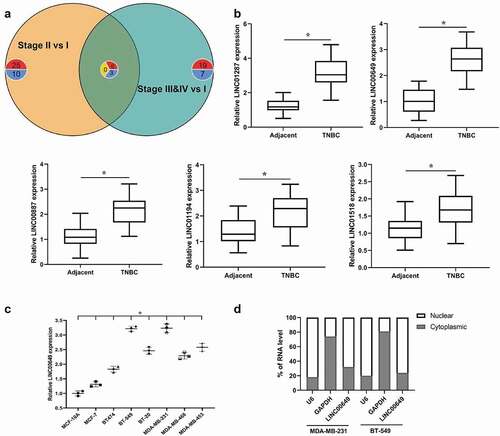
Figure 2. Interference with LINC00649 inhibits TNBC cell proliferation, migration and invasion. si-control, si-LINC00649-1, si-LINC00649-2 were transfected into MDA-MB-231 and BT549 cells, and divided them into control group, si-control group, si-LINC00649-1 group and si-LINC00649-2 group. (a) QRT-PCR was used to detected LINC00649 level in the MDA-MB-231 and BT549 cells. (b) CCK-8 assay was performed to detect the cell viability. (c) Colony formation assay was used to detect cell clone formation ability. Transwell assay detected migration (d) and invasion abilities (e). Scale bar = 200 μm. *P < 0.05 vs. si-control.
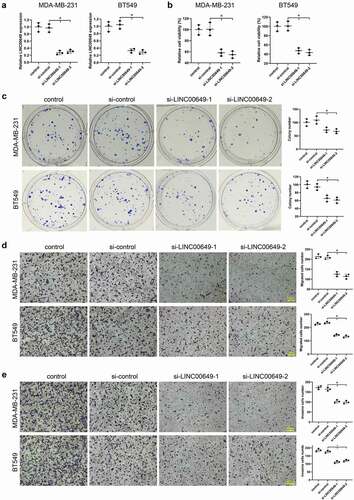
Figure 3. LINC00649 interacts with NF90 and NF45 in the MDA-MB-231 cells. The interaction between LINC00649 and NF90, LINC00649 and NF45 by RNA pull-down (a) and RIP experiments (b) in the MDA-MB-231 cells. MDA-MB-231 cells were grouped into si-control group and si-LINC00649 group. *P < 0.05 vs. IgG. (c) RIP assay was performed to detect the interaction between LINC00649 and NF90, LINC00649 and NF45 by qRT-PCR. *P < 0.05 vs. si-control. (d) Western blot was used to detect the protein levels of NF90 and NF45. MDA-MB-231 cells were transfected with si-NF90-1, si-NF90-2, si-NF45-1, si-NF45-2. (e) QRT-PCR was used to detected LINC00649 level.
Figure 4. LINC00649 regulates HIF-1α mRNA stability by binding with NF90/NF45. MDA-MB-231 and BT549 cells were transfected with si-control, si-LINC00649-1, or si-LINC00649-2, si-NF90-1, si-NF90-2, si-NF45-1, si-NF45-2, si-NF45-1, si-NF45-2, respectively. The HIF-1α mRNA level and protein expression were detected by qRT-PCR (a) and Western blot (b). MDA-MB-231 and BT549 cells transfected with si-LINC00649-1 or si-LINC00649-2 were treated with actinomycin D. *P < 0.05 vs. si-control. HIF-1α mRNA levels in the MDA-MB-231 (c) and BT549 cells (d) were detected by qRT-PCR. *P < 0.05, **P < 0.01 vs. si-control. (e) RIP assay was performed to detect the interaction between NF90 and HIF-1α, NF45 and HIF-1α. *P < 0.05 vs. IgG. (f) The interaction between HIF-1α and NF90 was verified by RIP assay. *P < 0.05 vs. si-control.
Figure 5. LINC00649 promotes the proliferation, migration and invasion of TNBC cells through regulating HIF-1α level. Hypoxic MDA-MB-231 and BT549 cells were grouped into si-control, hypoxia+si-control, hypoxia+si-LINC00649, hypoxia+si-LINC00649+ pcDNA, hypoxia+si-LINC00649+ pcDNA-HIF-1α groups. (a) QRT-PCR was used to detected LINC00649 level. (b) The HIF-1α mRNA level and protein expression were detected by qRT-PCR and Western blot. (c) Western blot was used to detect the protein levels of VEGFA, ANGPTL4 and LOX. (d) CCK-8 assay was performed to detect the cell viability. (e) Colony formation assay was used to detect cell clone formation ability. Transwell assay detected migration (f) and invasion abilities (g). *P < 0.05 vs. si-control/hypoxia+si-control/hypoxia+si-LINC00649+ pcDNA.
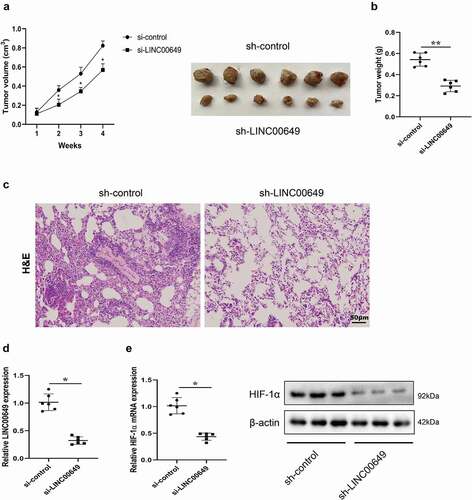
Figure 6. LINC00649 promoted the growth and metastasis of TNBC in vivo. A mice subcutaneous tumor model was established by subcutaneously injecting MDA-MB-231 cells transfected with sh-control or sh-LINC00649 into nude mice (n = 6/group). (a) Tumor volume was measured weekly. (b) Tumor weight was measured after 4 weeks. Pulmonary metastasis model was established by injecting MDA-MB-231 cells transfected with sh-control or sh-LINC00649 were injected into nude mice via tail vein (n = 6/group). (c) After 4 weeks, HE staining was performed to detect the degree of tumor metastasis. Scale bar = 50 µm. (d) QRT-PCR was used to detected LINC00649 level in the tumors. (e) The HIF-1α mRNA level and protein expression in the tumors were detected by qRT-PCR and Western blot. *P < 0.05, **P < 0.01 vs. si-control.