Figures & data
Figure 1. MiR-144-5p was verified to be low-expressed in thyroid carcinoma.
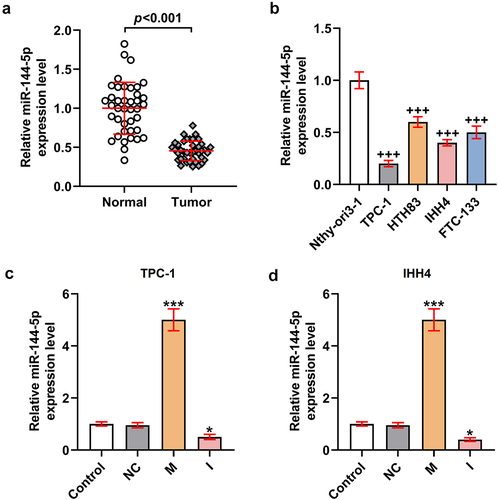
Figure 2. MiR-144-5p mimic suppressed the viability, proliferation, migration, and invasion of TPC-1 and IHH4 cells, and miR-144-5p caused the opposite results.
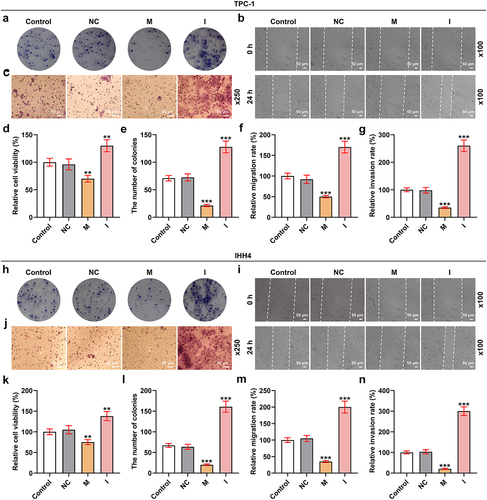
Figure 3. MiR-144-5p targeted STON2 and down-regulated the expression of STON2 in TPC-1 and IHH4 cells.
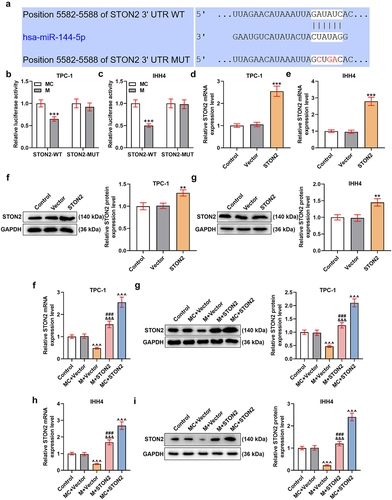
Figure 4. MiR-144-5p mimic weakened the promoting effect of STON2 overexpression on migration and invasion of TPC-1 and IHH4 cells.
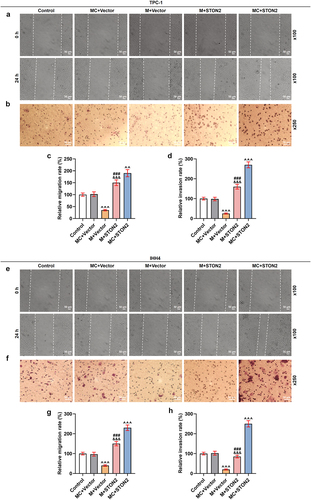
Figure 5. MiR-144-5p mimic enhanced the inhibitory effects of PTX on cell viability, proliferation, migration, and invasion of TPC-1 and IHH4 cells.
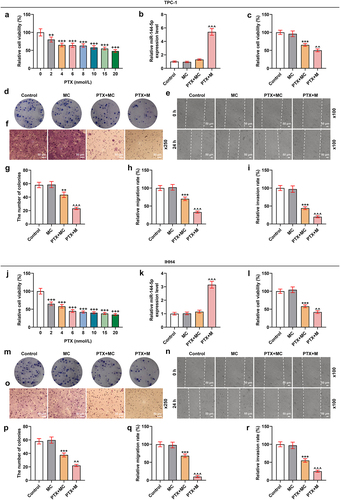
Figure 6. The effect of UTMD-mediated miR-144-5p overexpression on the miR-144-5p expression, proliferation, and invasion of PTX-induced TPC-1 and IHH4 cells was stronger than liposome-mediated miR-144-5p overexpression.
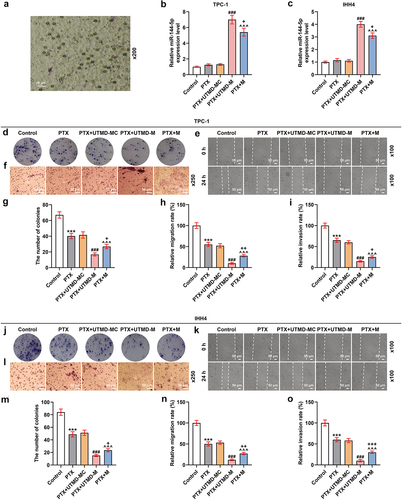
Figure 7. The effect of UTMD-mediated miR-144-5p overexpression on the miR-144-5p expression, proliferation, and invasion of PTX-induced TPC-1 and IHH4 cells was stronger than liposome-mediated miR-144-5p overexpression.
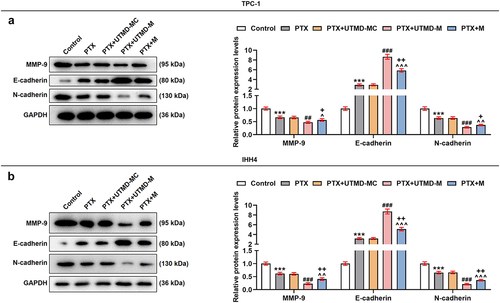
Figure 8. The effect of UTMD-mediated miR-144-5p overexpression on STON2-overexpressed TPC-1 and IHH4 cells was stronger than liposome-mediated miR-144-5p overexpression.
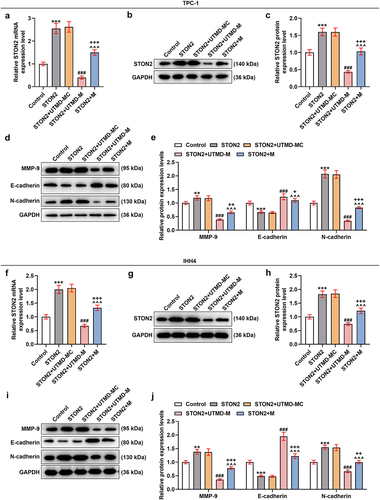
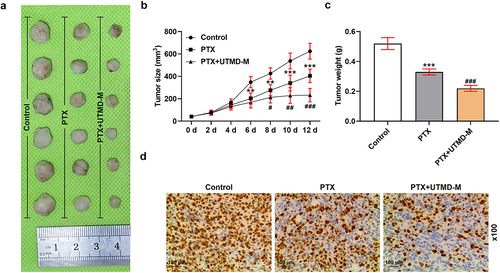
Figure 9. UTMD-mediated miR-144-5p overexpression enhanced the inhibitory effects of PTX on the growth of subcutaneous-xenotransplant tumor.