
Figures & data
Figure 1. Mitochondrial reprogramming during the conversion of iPSCs into NSCs.
A. Schematic diagram of the reprogramming of iPSCs into NSCs. B. Representative phase-contrast images (a) and TEM images (b) of iPSCs and representative phase-contrast images (c) and TEM images (d) of differentiated NSCs and confocal images of immunostaining for NSCs with NESTIN (red, e) and SOX2 (green, f). The scale bar is 200 nm or 50 µm. C-E. Flow cytometric analysis of total MMP measured by TMRE (C), mitochondrial volume measured by MTG (D) and specific MMP level calculated by total TMRE/MTG (E) during neural induction. F. Measurement of intracellular ATP production using a live cell luminescence assay during neural induction. G. Flow cytometric measurements of specific intracellular ROS calculated by total ROS/MTDR using double staining of DCFDA and MTDR during neural induction. H. Flow cytometric analysis of TOMM20 protein expression during neural induction. I. Flow cytometric analysis of TFAM protein expression at the specific TFAM level calculated by total TFAM/TOMM20 during neural induction. J. Relative mtDNA copy number was analyzed by qRT-PCR using mitochondrial gene ND1 and nuclear gene APP and calculated by ND1/APP during neural induction. K. Flow cytometric analysis of MRC complex I subunit NDUFB10 protein expression at the specific level calculated by total NDUFB10/TOMM20 during neural induction. .L-N. LC-MS-based metabolomics for quantitative measurements of NAD+ (L), NADH (M) and NAD+/NADH ratio (N) during neural induction. The Y-axis in C-N represents the fold change in NSCs over their iPSCs.
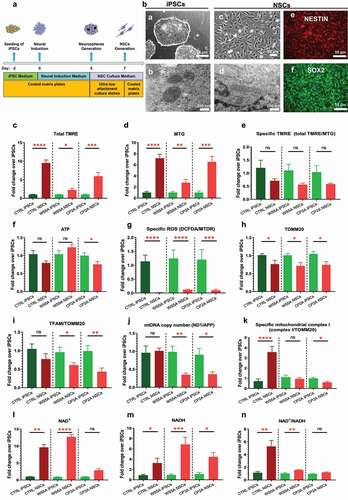
Figure 2. Mitochondrial reprogramming during the conversion of NSCs into DA neurons.
A. Schematic diagram of the reprogramming of NSCs into DA neurons. B. Representative phase-contrast images (a) and TEM images (c) of the differentiated DA neurons and confocal images of immunostaining for DA neuronal markersTH (red, b) and DAT (green, d). The scale bar is 200 nm or 50 µm. C-E. Flow cytometric analysis of MMP at the total level measured by TMRE (C), mitochondrial volume measured by MTG (D) and specific MMP level calculated by total TMRE/MTG (E) during neural differentiation. F. Measurement of intracellular ATP production using a live cell luminescence assay during neural differentiation. G. Flow cytometric measurements of specific intracellular ROS calculated by total ROS/MTDR using double staining of DCFDA and MTDR during neural differentiation. T H. Flow cytometric analysis of TOMM20 protein expression during neural differentiation. I. Flow cytometric analysis of TFAM protein expression at the specific TFAM level calculated by total TFAM/TOMM20 during neural differentiation. J. Relative mtDNA copy number analyzed by qRT-PCR and calculated by ND1/APP during neural differentiation. K. Flow cytometric analysis of MRC complex I subunit NDUFB10 protein expression at the specific level calculated by total NDUFB10/TOMM20 during neural differentiation. The Y-axis in C-K represents the fold change in DA neurons over their NSCs.
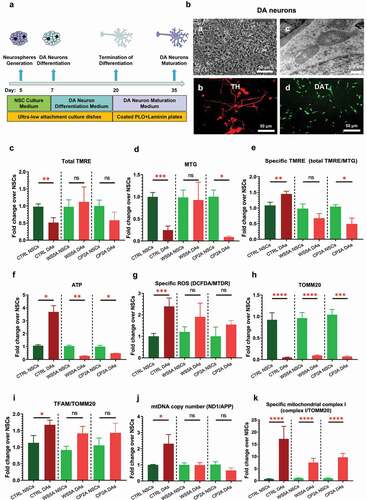
Figure 3. Mitochondrial reprogramming during the conversion of NSCs into glial astrocytes.
A. Schematic diagram of reprogramming of NSCs into astrocytes. B. Representative phase-contrast images (a) and TEM images (b) of the differentiated astrocytes and confocal images of immunostaining for astrocyte markers with GFAP (red, c) and S100 beta (green, d). The scale bar is 200 nm or 50 µm. C-E. Flow cytometric analysis of MMP at the total level measured by TMRE (C), mitochondrial volume measured by MTG (D) and the specific MMP level calculated by total TMRE/MTG (E) during astrocyte differentiation. F. Measurement of intracellular ATP production using a live cell luminescence assay during astrocyte differentiation. G. Flow cytometric measurements of specific intracellular ROS calculated by total ROS/MTDR using double staining of DCFDA and MTDR during astrocyte differentiation. H. Flow cytometric analysis of TOMM20 protein expression during astrocyte differentiation. I. Flow cytometric analysis of TFAM protein expression at the specific TFAM level calculated by total TFAM/TOMM20 during astrocyte differentiation. J. Relative mtDNA copy number analyzed by qRT-PCR and calculated by ND1/APP during astrocyte differentiation. K. Flow cytometric analysis of MRC complex I subunit NDUFB10 protein expression at the specific level calculated by total NDUFB10/TOMM20 during astrocyte differentiation. L. LC-MS-based metabolomics for quantitative measurements of NAD+/NADH ratio during astrocyte differentiation. The Y-axis in C-L represents the fold change in astrocytes over their NSCs.
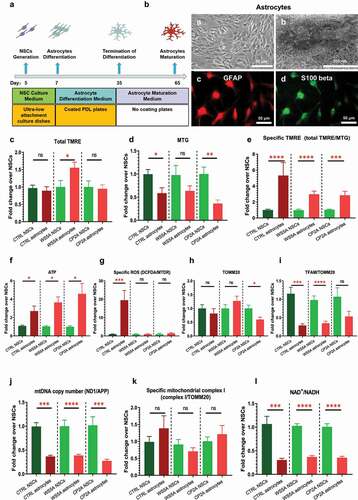
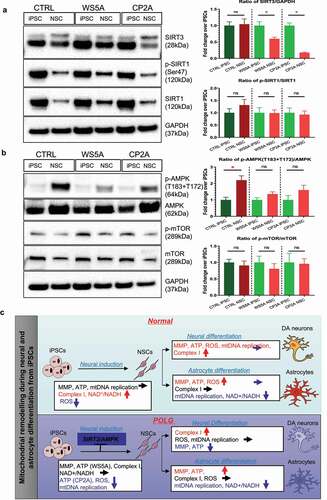
Figure 4. Abnormal mitochondrial reprogramming via downregulation of the SIRT3/AMPK signaling pathway during neural induction in POLG cells.
A. Representative images and quantitative measurements of Western blotting for SIRT3, p-SIRT1, SIRT1 and GAPDH. B. Representative images and quantitative measurements of Western blotting for p-AMPK (T183+ T172), AMPK, p-mTOR, mTOR and GAPDH. The Y-axis in A-B represents the fold change of the value for NSCs over their iPSCs. C. Summary of the mitochondrial remodeling during the neural induction and neural/astrocyte differentiation phases in both normal condition and POLG cells.
Supplemental material
Supplemental Material
Download Zip (8.1 MB)Data availability statement:
We confirm that the data supporting the findings of this study are available within the supplementary materials.