
Figures & data
Table 1. PCR primers utilized in this research
Figure 1. Expression of miR-509-5p in GSE44145 and GSE97842. (a) Expression of miRNAs in GSE44145. miRNAs with Log2 fold change (FC)>1.5 were marked Orange, miRNAs with log2FC <-1.5 were marked blue, and miR-509-5p was marked red. (b) Expression of miRNAs in GSE97842. miRNAs with Log2FC>1.5 were marked Orange, miRNAs with log2FC <-1.5 were marked blue, and miR-509-5p was marked red.
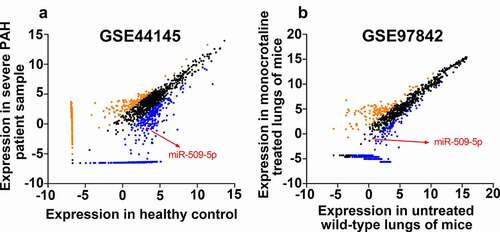
Figure 2. Expression characteristics of miR-509-5p in serum samples of PAH patients and PASMCs under hypoxia. (a) Expression of miR-509-5p in serum of PAH patients and healthy subjects was detected by qPCR. (b) Expression of miR-509-5p in PASMC under normoxia and hypoxia was detected by qPCR. *** denotes p < 0.001.
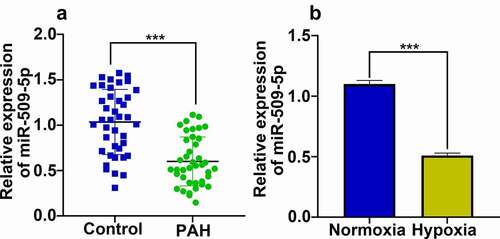
Figure 3. Effect of miR-509-5p on the phenotypes of PASMCs. (a) Cell models with overexpressed or reduced miR-509-5p were established in PASMCs. (b, c) CCK-8 assay was employed for detecting the effect of miR-509-5p overexpression or inhibition on the proliferation of PASMCs. (d) Effect of miR-509-5p overexpression or inhibition on the migration of PASMCs was assessed with Transwell assay. (e) Effect of miR-509-5p overexpression or inhibition on PASMC apoptosis was detected by flow cytometry. *, **, *** represent p < 0.05, p < 0.01 and p < 0.001 respectively. In (b), *, ** indicate p < 0.05 and p < 0.01 by comparison with normoxia group. & indicates that p < 0.05 by comparison with hypoxia+mimics NC group. In (c), *, ** indicate p < 0.05 and p < 0.01 by comparison with normoxia group. &, && represent p < 0.05 and p < 0.01 respectively by comparison with hypoxia+inhibitors NC group.
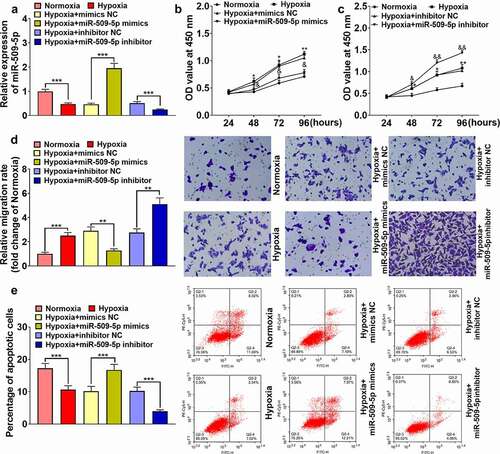
Figure 4. Expression of DNMT1 was targetedly inhibited by miR-509-5p. (a) Binding site between miR-509-5p and DNMT1 3ʹUTR was predicted by TargetScan database. (b) Expression of DNMT1 in the serum of patients with PAH and healthy subjects was detected by ELISA. (c) Expression of DNMT1 mRNA in PASMCs under normoxia and hypoxia was detected by qPCR. (d) The targeted binding relationship between miR-509-5p and DNMT1 was verified by dual-luciferase reporter gene assay. (e) Expression of DNMT1 mRNA in miR-509-5p overexpression and low expression models was quantified by qPCR. (f) Expression of DNMT1 in miR-509-5p overexpression and low expression models was detected by Western blot. ** and *** represent p < 0.01 and p < 0.001 respectively.
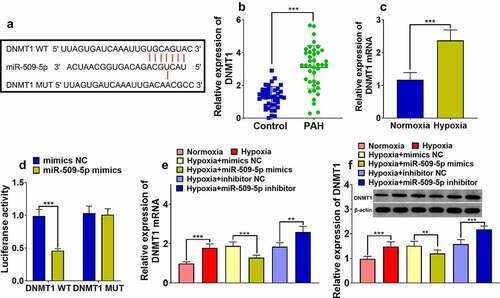
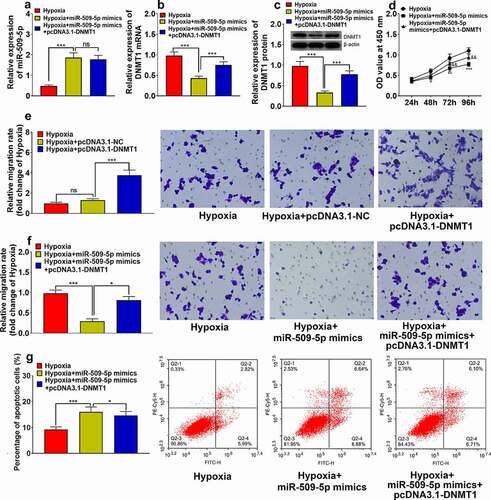
Figure 5. Overexpression of DNMT1 counteracted effect of miR-509-5p on PASMC. (a) Expression of miR-509-5p in PASMCs was detected by qPCR after the co-transfection of miR-509-5p and pcDNA3.1-DNMT1. (b) Expression of DNMT1 mRNA in PASMCs was assessed by qPCR after the transfection. (c) Expression of DNMT1 in PASMCs was detected by Western blot after the transfection. (d) CCK-8 assay was utilized for detecting PASMC proliferation after the transfection. (f) Transwell assay was employed for detecting PASMC migration after DNMT1 overexpression. Transwell assay was employed for detecting PASMC migration after the transfection. (g) The apoptosis of PASMCs was detected by flow cytometry after the transfection. *, **, *** represent p < 0.05, p < 0.01 and p < 0.001 respectively. In (d), *, **, *** represent differences between hypoxia group and hypoxia+miR-509-5p mimics group (p < 0.05, p < 0.01, p < 0.001); && represents difference between hypoxia+miR-509-5p mimics group and hypoxia+miR-509-5p mimics+pcDNA3.1-DNMT1 group (p < 0.01).
Supplemental Material
Download TIFF Image (736.5 KB)Data Availability Statement
The data used to support the findings of this study are available from the corresponding author upon reasonable request.