
Figures & data
Figure 1. Human LHPP expression levels in different tumor types from The Cancer Genome Atlas database were determined by TIMER (https://cistrome.shinyapps.io/timer/), and the differential expression was evaluated by Wilcoxon test. TPM:Transcripts Per Million. Red: Tumor, Blue: Normal. (*P < 0.05, **P < 0.01, ***P < 0.001).
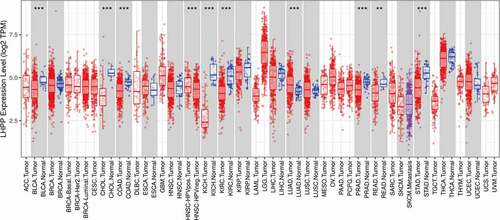
Table 1. Effect of LHPP upregulation in tumor cells
Table 2. Effect of LHPP downregulation in tumor cells
Figure 2. Molecular mechanism of LHPP.
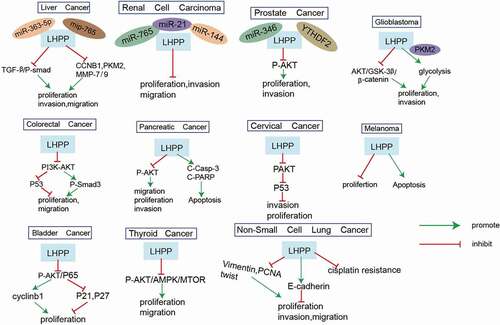
Table 3. Clinical characteristics of LHPP in various tumors
Supplemental material