Figures & data
Figure 1. Platelet transfusion from wild-type C57BL/6 mice significantly increased platelet count but had no other substantial effects. (a) Platelet count before and after platelet transfusion (48 h). (b) Weekly body weight. (c) Weekly water intake. (d) Weekly food intake.
Figure 2. Platelet transfusion from wild-type C57BL/6 mice had affected except platelet count, liver and kidney function, but had no other effect on blood system. (a) White blood cell counts. (b) Red-blood-cell-related indicators. (c) Platelet-cell-related indicators. (d) Liver enzyme levels. (e) Kidney function indicators. Abbreviations: HFD, high-fat diet; WBC, white blood cell; LYM, lymphocyte; NEU, neutrophils; MON, monocyte; EOS, eosinophils; BAS, basophils; RBC, red blood cell; HGB, hemoglobin concentration; HCT, hematocrit; MCV, mean red blood cell volume; MCH, mean corpuscular hemoglobin amount; MCHC, mean erythrocyte hemoglobin concentration; RDW-CV, red blood cell volume distribution width; RDW-SD, red blood cell volume distribution width; MPV, mean platelet volume, PCT, platelet packed product; PDW, platelet distribution width; P-LCC, large platelet count.
Figure 3. Alteration in lipid metabolism in atherosclerotic mice were significantly ameliorated by platelet intervention, but blood pressure and glucose levels remained unchanged. (a) Total cholesterol (TC) levels. (b) Triglycerides (TG) levels. (c) Low-density lipoprotein cholesterol (LDL-C) levels. (d) High-density lipoprotein cholesterol (HDL-C) levels. (e) Systolic blood pressure (SBP) levels. (f) Diastolic blood pressure (DBP) levels. (g) Heart rate levels. (h) Fasting blood glucose (FBG) levels. Abbreviations: HFD, high-fat diet.
Figure 4. Platelet transfusion from wild-type C57BL/6 mice suppressed plaque formation in the aorta from atherosclerotic mice. (a) Representative photographs of Hematoxylin–Eosin (H&E) staining. (b) Atherosclerotic plaque of aortic sections stained with Oil Red O staining. (c) Atherosclerotic plaque of the aortic tree stained with Sudan IV. (d) Quantitative analysis of the atherosclerotic plaque area in the aortic tree.
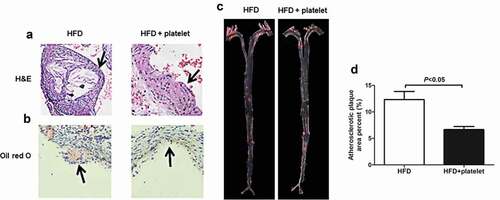
Figure 5. Platelet transfusion from wild-type C57BL/6 mice inhibited infiltration of inflammatory factors in the aorta from atherosclerotic mice after fed with a high-fat diet (HFD) for 8 weeks. (a) and (c) Immunostaining for tumor necrosis factor-α (TNF-α), interleukin-1β (IL-1β), IL-6, and monocyte chemoattractant protein-1 (MCP-1); the black arrow represents the lesion. (b) and (d) An enlarged view of the part pointed by the black arrow in (a) and (c) respectively; and the red arrow showing positive cells for each cytokine. (e)–(h) Quantitative analysis of TNF-α, IL-1β, IL-6, and MCP-1; cytokines + index means mean density, defined as positive integrated optical density (IOD)/pixel area of the tissue (AREA) for each immunohistochemical image. Abbreviations: HFD, high-fat diet.
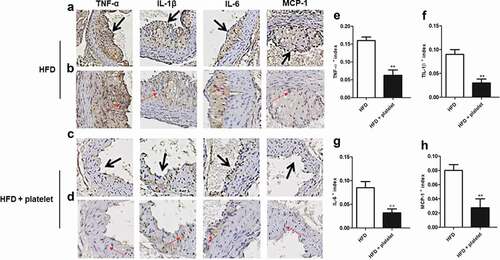
Figure 6. Platelet transfusion from wild-type C57BL/6 mice inhibited expression of inflammatory proteins in the aorta and in the peripheral blood from atherosclerotic mice; inflammatory cytokines were measured after fed with a high-fat diet (HFD) for 8 weeks with or without platelet transfusion. (a) Protein band diagram, C1–C5 represent the high-fat diet (HFD) group, E1–E5 represent the HFD+platelet group. (b) Western blot analysis of tumor necrosis factor-α (TNF-α), interleukin-1β (IL-1β), IL-6, and monocyte chemoattractant protein-1 (MCP-1). The ratio of TNF-α, IL-1β, IL-6, or MCP-1 proteins is set to “1” for the HFD group. (c) TNF-α, IL-1β, IL-6, and MCP-1 were measured by enzyme-linked immunosorbent assay (ELISA) from peripheral blood.