
Figures & data
Figure 1. Morphology and growth curve of cultured sheep fetal fibroblasts cells (FFCs): (a) the morphology of generation 3 fibroblasts, scale bars: 200 μm;(b) The “S” shape of growth curve.
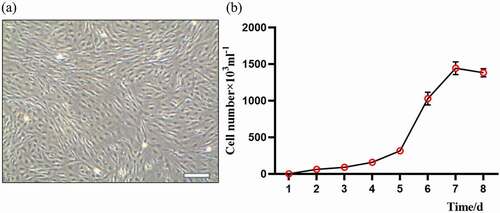
Table 1. Effect of different concentrations of MT on cell viability at different culture time points (Cell viability/%)
Figure 2. The effect of MT treatment on cell proliferation and cloning of FFCs: (a) Cell proliferation was analyzed by CCK8 assay. The value of absorbance was positively related to the number of live cells; (b) The cloning efficiency was measured by flow cytometry. The number of monoclonal cells were counted. Con, control. Values were mean ± standard error of the mean of 3 times independent experiments *P < 0. 05 vs other groups.
Figure 3. Effects of MT on electrotransferring efficiency. (a) Photo of positive transfected FFCs at 48 h after electrotransfection, scale bars: 100 μm. (b) Map of plasmid expressing GFP fluorescence. (c) Flow cytometry profiles. The fixed cells were analyzed on a flow cytometer until 20, 000 cells were counted to calculate. (d) The statistical analysis on the data obtain from (c). (f) Flow cytometry profiles. The fixed cells were analyzed on a flow cytometer until 20, 000 cells were counted to calculate. (e) The apoptotic rate; The electro-transfection efficiency distribution was analyzed using Modfit software. The statistical analysis on the data obtain from (f)The data were expressed as mean ± standard error of 3 times independent experiments, * P < 0. 05 vs. Control (electroporation alone group).
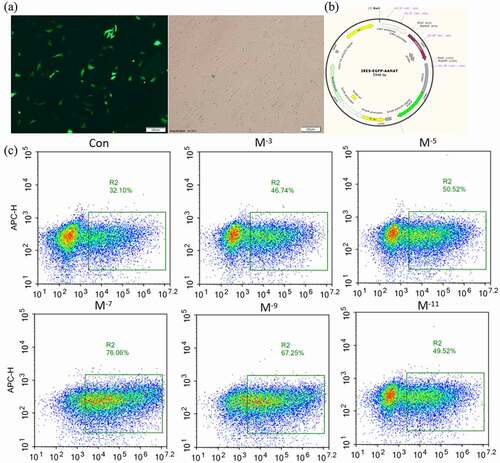
Figure 3. Continued.
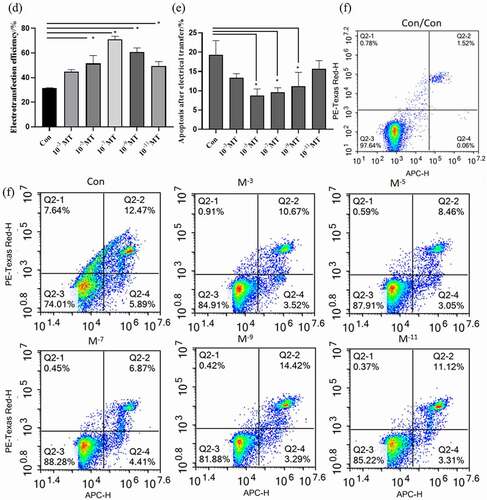
Figure 4. The effect of MT treatment on FFCs synchronization at different cell cycle phases. (a) DNA histograms, by flow cytometry, the difference in the count collected did not affect the experimental results. (b) Ratio of cells in different cell cycle phases for each group of cultured. Con, control; Data were expressed as e mean ± standard error of the mean of 3 times independent experiments. * P < 0. 05 vs. control group.
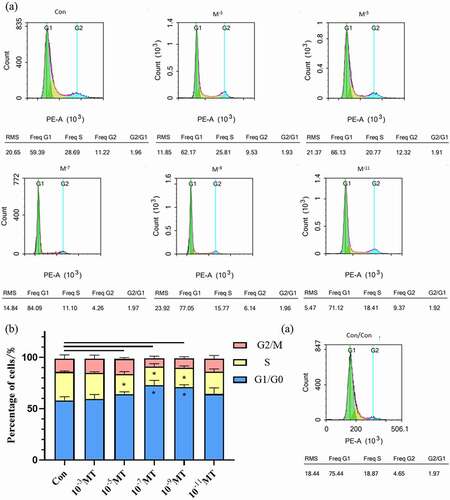
Figure 5. Effects of MT on ROS production during electroporation and mitochondrial density. (a) Flow cytometry profiles of intracellular ROS staining. (b) The statistical analysis of the data from A. (c) Representative images of mitochondrial level in FFCs, the right picture scale bars: 100 μm; (d) The statistical analysis of the data from C based on the intracellular relative fluorescence intensity of mitochondria. Data were expressed as mean ± standard error of the mean of 3 times independent experiments. * P < 0. 05 vs. control (electroporation alone group).
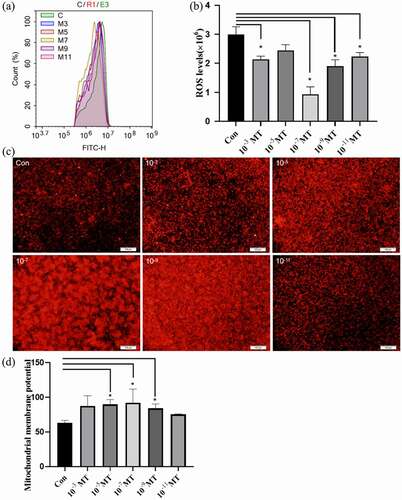
Figure 6. Effects of MT on the maturation, fertilization and early embryo development efficiency in cultured of sheep oocytes: (a) The morphology of normal sheep oocyte. The upper and lower two are different experimental groups. The picture on the right is enlarged and observed more clearly, the right picture scale bars: 200 μm; (b) Expansion of cumulus cell after in vitro maturation. The picture on the right is enlarged and observed more clearly, the right picture scale bars: 200 μm; (c) Photo of polar body excretion. The left picture enlarges the polar body, the right picture of scale bars: 200 μm; (d) The statistical analysis of the data obtained from C; (e) The cleavage rate of sheep oocytes after in vitro fertilization; (f) The blastocyst rate of sheep oocytes after in vitro fertilization, MT/CON before “+“ means adding MT/control group during IVM, MT/CON after ”+” means adding MT/control group during IVC. Data were expressed as mean ± standard error of the mean of 3 times oocytes or embryos. * P < 0. 05 vs. respective groups.
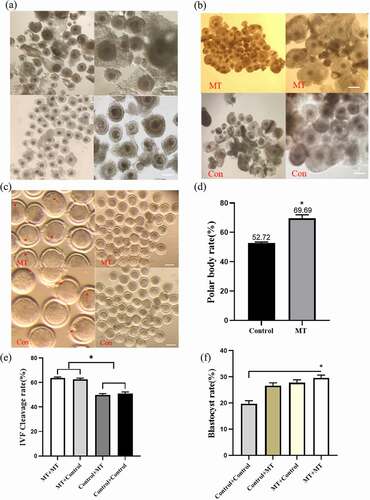
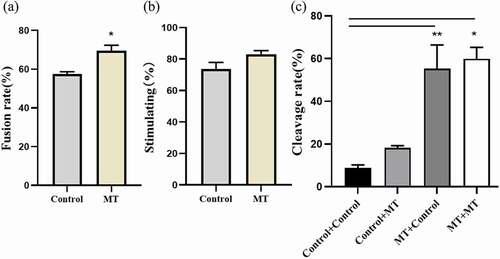
Figure 7. Effects of MT on SCNT embryo development: (a) The fusion rate of sheep embryo after SCNT; (b) The stimulating rate of sheep embryo after SCNT; (c) The Cleaved rate of sheep embryo after SCNT, MT: MT. Before “+” indicated the IVM stage and after “+” indicated IVC stage. Data were expressed as mean ± standard error of the mean of 3 times samples. * P < 0. 05 vs. respective groups.** P < 0. 01 vs. respective groups.
Data availability statement
The data used to support the findings of this study are available from the corresponding author upon request.