Figures & data
Figure 1. NUSAP1 expression is up-regulated in high grade gliomas and inversely associated with glioblastoma patient prognosis. A. Relative expression levels of NUSAP1 mRNA in normal brain (NBT), low grade glioma (LGG) and high grade glioma tissue samples from the CGGA, TCGA and rembrandt databases. **P < 0.01 and ***P < 0 .001. B. Kaplan-Meier analyses showing differences in overall survival for patients with low and high NUSAP1 expressing gliomas from CGGA, TCGA and rembrandt databases. C. Representative images of immunohistochemical staining for NUSAP1 in 4-μm sections from normal brain tissue samples (NBT), and grade II, III and IV (GBM) gliomas. Scale bar = 100 μm. D. Immunohistochemical scores for NUSAP1 in normal brain tissue samples (NBT), and grade II, III, and IV (GBM) gliomas. Five random fields from each section were counted. Data are shown as the mean ± SD. *P < 0.05, **P < 0 .01 and ***P < 0.001. E. Western blot analysis of NUSAP1 levels in grade II, III and IV gliomas. F. Western blot analysis of NUSAP1 levels in U87, A172, U251,T98 and GBM patient derived P3 cell lines.
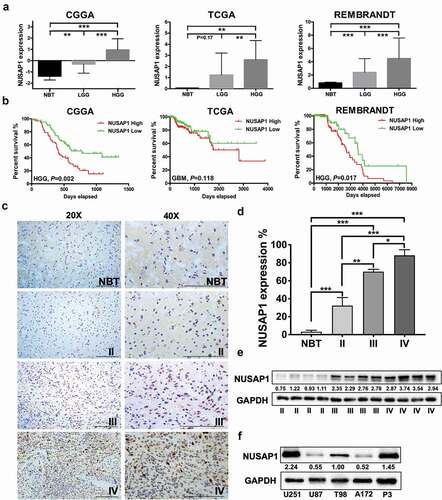
Figure 2. Down-regulation NUSAP1 expression inhibits glioma cell proliferation and invasion, and induces apoptosis. A. Correlation between mRNA expression of NUSAP1 and proliferation-related molecules MKI67 and PCNA in primary and recurrent gliomas samples in the CGGA database. B. Western blot to confirm knockdown efficiency of NUSAP1 with siRNA in U251, T98, and P3 cells. C. Fluorescence microscopy of EdU incorporation in U251, T98, and P3-siN1-2,-3 siRNAs. Pollo 567 (red color) detects EdU, while DAPI (blue color) stains nuclei. Scale bar = 50 μm. D. Statistical analysis of the number of EdU-positive cells for U251, T98, and P3 cell lines transfected with siRNAs. All data are expressed as the mean ± SD of values from experiments performed in triplicate. **P < 0.01. E. Transwell invasion results of si-NC/N1-2,-3 in U251, T98 and P3 GBM cells for 24 h. Scale bar = 100 μm. F. Statistical results of the invasive ratio of si-NC/N1-2, −3 in U251, T98 and P3 GBM cells for 24 h. **P < 0.01. G. Flow cytometric analysis to detect apoptosis in U251, T98, and P3-siN1-2, −3 siRNA cells as determined by annexin V-and/or FITC and propidium iodide staining for DNA content. The percentages of annexin V-and/or FITC-positive cells are indicated.
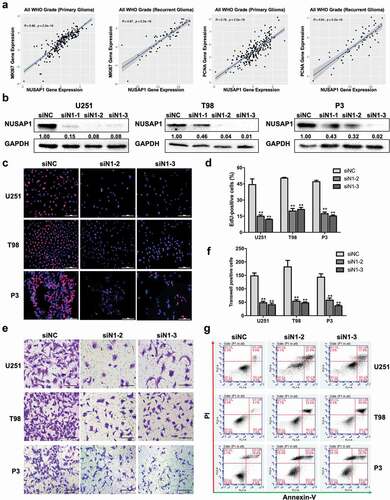
Figure 3. Down-regulation of NUSAP1 inhibits mRNA and protein expression levels of TOP2A in GBM cells. A. Hierarchical clustering based on the differentially expressed genes obtained through RNA sequencing of P3 siNC and P3 siN1 cells. B. Significantly up- or down-regulated genes identified through analysis of RNA sequencing data obtained from stable knockdown of NUSAP1 in P3 cells. C. Results of quantitative RT-PCR with different primers. Data are shown as the mean ± SD. *P < 0.05, **P < 0.01 and ***P < 0.001. D. STRING, is a bioinformatics tool developed to aid in the prediction of protein association networks. E. Western blot analysis of NUSAP1 and TOP2A levels in U251 and P3 cell lines transfected with NUSAP1 siRNAs.
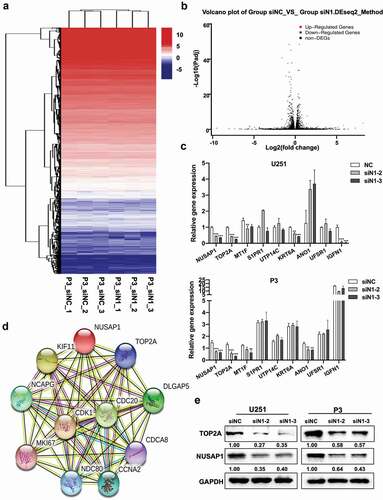
Figure 4. Down-regulation TOP2A expression inhibits glioma cell proliferation and invasion, and induces apoptosis in glioma cells. A. Correlation between NUSAP1 and TOP2A mRNA expression levels in primary and recurrent gliomas samples in the CGGA database. B. Kaplan-Meier analyses showing differences in overall survival for patients with low and high TOP2A expressing in primary and recurrent gliomas. The data were obtained from CGGA databases. C. Western blot to confirm siRNA knockdown efficiency of TOP2A in U251 and P3 cells. D. Fluorescence microscopy of EdU incorporation in U251 and P3-siTOP2A-1, −2 siRNAs. Pollo 567 (red color) detects EdU, while DAPI (blue color) stains nuclei. Scale bar = 50 μm. E. Statistical analysis of the number of EdU-positive cells for U251 and P3 cell lines transfected with siRNAs. All data are expressed as the mean ± SD of values from experiments performed in triplicate. **P < 0.01. F. Transwell invasion results of siNC/TOP2A-1, −2 U251 and P3 GBM cells for 24 h. Scale bar = 100 μm. G. Statistical results of the invasive ratio of siNC/TOP2A-1, −2 in U251 and P3 GBM cells for 24 h. **P < 0.01. H. Flow cytometric analysis of apoptosis in U251- and P3-siTOP2A-1,-2 siRNAs cells as determined with annexin V-and/or FITC and propidium iodide staining for DNA content. The percentages of annexin V-and/or FITC-positive cells are indicated.
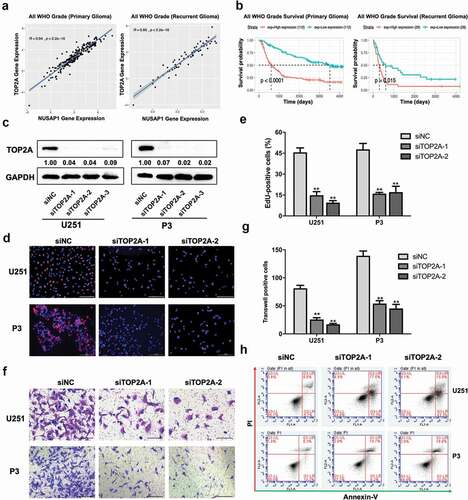
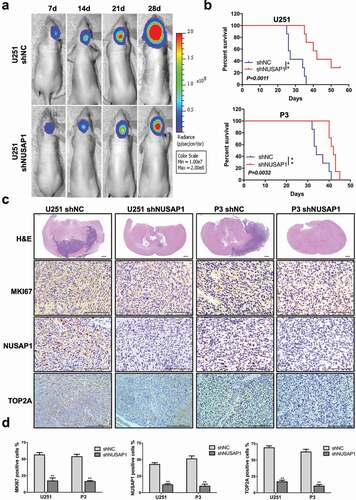
Figure 5. Down-regulation of NUSAP1 inhibits the expression of TOP2A, and leads to reduced glioma growth and invasion in vivo. A. U251 cells expressing luciferase were orthotopically implanted into athymic nude mice. Tumor growth was monitored using the IVIS-200 imaging system for detection of bioluminescence. Bioluminescent signals were measured at days 7, 14, 21, and 28 after implantation. B. Kaplan-Meier survival analysis of overall survival, and log rank analysis to assess the statistical significance of the differences. C. Representative images of H&E staining and immunohistochemical staining for NUSAP1, MKI67, and TOP2A in xenograft sections from mice injected with U251- and P3-shNC or U251- and P3-shNUSAP1 cells. Scale bar = 100 μm. D. Graphic representation of IHC scoring for NUSAP1, MKI67, and TOP2A expression in xenograft sections. All data are presented as the mean ± SD, **P < 0.01.