
Figures & data
Table 1. Clinical parameters of atherosclerosis patients.
Figure 1. LncRNA DLEU2, high-expressed in atherosclerosis, affected PDGF-BB-induced biological phenotype of VSMCs. (a) The mRNA expression of DLEU2 was analyzed using RT-qPCR in human atherosclerotic serum (n = 34) and normal serum (n = 20). (b) The mRNA expression of DLEU2 was analyzed using RT-qPCR in Control, PDGF-BB, PDGF-BB+pcDNA3.1-NC, PDGF-BB+DLEU2 and PDGF-BB+siDLEU2 groups. (c) Cell Counting Kit-8 (CCK-8) assay was performed to test the cell viability in each group. (d-e) The cell migration ability in each group was analyzed by wound healing assay. (f-g) Transwell assay was applied to determine cell invasion ability. β-actin was used as a control. PDGF-BB: platelet-derived growth factor-BB. RT-qPCR: reverse transcription quantitative PCR. NC: negative control. VSMCs: vascular smooth muscle cells. All experiments were repeated at least three times. **P < 0.01, ***P < 0.001 vs. Control, ^P < 0.05, ^^P < 0.01, ^^^P < 0.001 vs. PDGF-BB+pcDNA3.1-NC. Data were expressed as mean ± standard deviation. Data between two groups or among multiple groups were analyzed by independent sample t test or one-way ANOVA, followed by Tukey’s post hoc test.
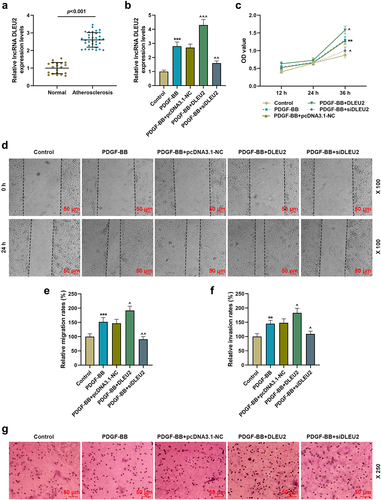
Figure 2. LncRNA DLEU2 competitively bound to miR-212-5p. (a) StarBase v2.0 (http://starbase.sysu.edu.cn/index.php) and (b) dual luciferase reporter assay were adopted to analyze the binding relationship between DLEU2 and miR-212-5p. (c) The expression of miR-212-5p was analyzed using RT-qPCR in human atherosclerotic serum (n = 34) and normal serum (n = 20). (d) Pearson correlation method was applied to analyze the correlation between the expressions of DLEU2 and miR-212-5p in the plasma of patients with atherosclerosis (n = 34). ###P < 0.001 vs. miR-NC. All experiments were repeated at least three times. Data were expressed as mean ± standard deviation. Data between two groups or among multiple groups were analyzed by independent sample t test or one-way ANOVA, followed by Tukey’s post hoc test.
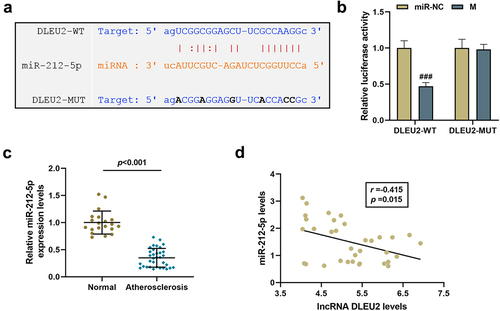
Figure 3. The promoting effect of lncRNA DLEU2 on the biological phenotype of VSMC induced by PDGF-BB was reversed by miR-212-5p mimic. VSMC was induced by PDGF-BB, with or without different RNA transfection. (a) RT-qPCR was conducted to detect the expression of miR-212-5p in each group of cells. U6 was used as a control. (b) CCK-8 assay was used for the determination of cell viability. (c-d) The effect of miR-212-5p mimic on cell migration ability was tested by wound healing assay. (e-f) Transwell assay was performed to determine cell invasion. *P < 0.05, **P < 0.01, ***P < 0.001 vs. PDGF-BB, ^^^P < 0.001 vs. PDGF-BB+DLEU2+ miR-NC, #P < 0.05, ##P < 0.01, ###P < 0.001 vs. PDGF-BB+M. All experiments were repeated at least three times. Data were expressed as mean ± standard deviation. Data among multiple groups were analyzed by one-way ANOVA, followed by Tukey’s post hoc test.
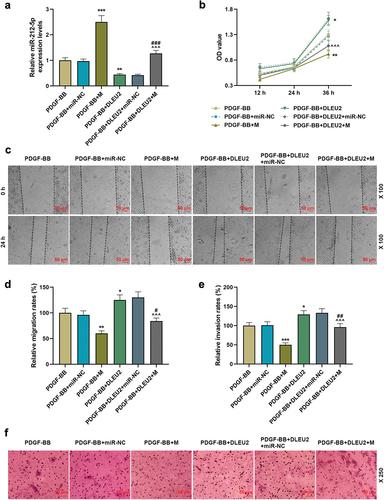
Figure 4. The effects of lncRNA DLEU2 and miR-212-5p mimic on the expressions of proliferating cell nuclear antigen (PCNA), α-smooth muscle actin (α-SMA) and Calponin in PDGF-BB-induced VSMCs were evaluated by western blot and RT-qPCR. β-actin was used as a control. *P < 0.05, **P < 0.01, ***P < 0.001 vs. PDGF-BB, ^P < 0.05, ^^^P < 0.001 vs. PDGF-BB+DLEU2+ miR-NC, #P < 0.05, ###P < 0.001 vs. PDGF-BB+M. All experiments were repeated at least three times. Data were expressed as mean ± standard deviation. Data among multiple groups were analyzed by one-way ANOVA, followed by Tukey’s post hoc test.
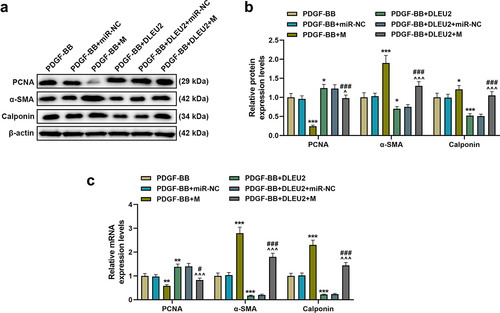
Figure 5. LncRNA DLEU2 up-regulated YWHAZ by competitively binding to miR-212-5p. (a) TargetScan v7.2 (http://www.targetscan.org/vert_72/) and (b) dual luciferase reporter assay were performed to analyze the targeting relationship between miR-212-5p and YWHAZ. (c) YWHAZ was up-regulated in atherosclerotic serum (n = 34) compared to normal serum (n = 20). (d-e) Pearson correlation method was used to analyze the correlation between YWHAZ and DLEU2 or miR-212-5p in atherosclerotic serum (n = 34). (f-h) Western blot and RT-qPCR were carried out to determine YWHAZ expression. β-actin was used as a control. *P < 0.05, **P < 0.01, ***P < 0.001 vs. PDGF-BB, ^^^P < 0.001 vs. PDGF-BB+DLEU2+ miR-NC, #P < 0.05, ##P < 0.01 vs. PDGF-BB+M; †††P < 0.001 vs. miR-NC. All experiments were repeated at least three times. Data were expressed as mean ± standard deviation. Data between two groups or among multiple groups were analyzed by independent sample t test or one-way ANOVA, followed by Tukey’s post hoc test.
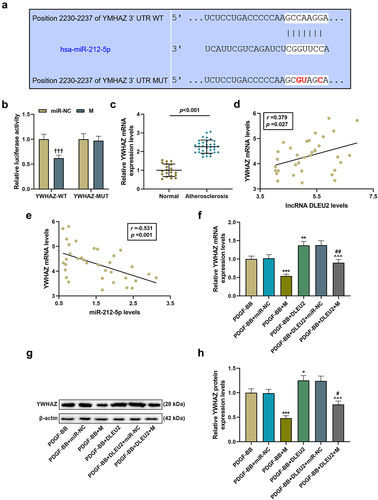
Figure 6. YWHAZ attenuated the effects of miR-212-5p mimic on the viability and migration of PDGF-BB-induced VSMCs, while siYWHAZ reversed the effects of overexpressed DLEU2. (a-c) The expression of YWHAZ in PDGF-BB+mimic (m) +NC, PDGF-BB+M+ YWHAZ, PDGF-BB+DLEU2+ siNC and PDGF-BB+DLEU2+ siYWHAZ groups was detected by RT-qPCR and Western blot. β-actin was used as a control. (d) YWHAZ overexpression partially reversed the inhibitory effect of miR-212-5p on cell viability, and siYWHAZ offset the promoting effect of DLUE2 on cell viability, which was confirmed by CCK-8 assay. (e-f) Wound healing assay was performed to measure the migration ability of cells in each group. *P < 0.05, **P < 0.01, ***P < 0.001 vs. PDGF-BB+M+ NC; ^^P < 0.01, ^^^P < 0.001 vs. PDGF-BB+DLEU2+ siNC. All experiments were repeated at least three times. Data were expressed as mean ± standard deviation. Data among multiple groups were analyzed by one-way ANOVA, followed by Tukey’s post hoc test.
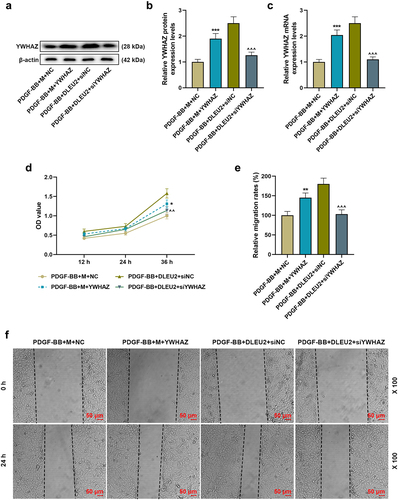
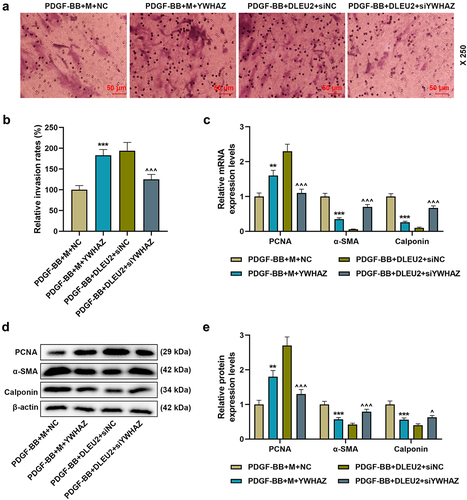
Figure 7. DLEU2 affected PDGF-BB-induced VSMC migration and the expressions of PCNA, α-SMA and Calponin through miR-212-5p/YWHAZ axis. (a-b) The invasion rate of cells in PDGF-BB+M+ NC, PDGF-BB+M+ YWHAZ, PDGF-BB+DLEU2+ siNC, and PDGF-BB+DLEU2+ siYWHAZ groups was assessed by Transwell assay. (c-e) The expressions of PCNA, α-SMA and Calponin were analyzed by RT-qPCR and Western blot. β-actin was used as a control. **P < 0.01, ***P < 0.001 vs. PDGF-BB+M+ NC; ^P < 0.05, ^^^P < 0.001 vs. PDGF-BB+DLEU2+ siNC. All experiments were repeated at least three times. Data were expressed as mean ± standard deviation. Data among multiple groups were analyzed by one-way ANOVA, followed by Tukey’s post hoc test.
Data availability statement
The analyzed data sets generated during the study are available from the corresponding author on reasonable request.