Figures & data
Figure 1. LEMD1-AS1 is down-regulated in OA tissues and LPS-treated chondrocytes. (a) The expression of LEMD1-AS1 in cartilage tissues of OA patients was detected by qRT-PCR. (b) The expression of LEMD1-AS1in chondrocytes treated with LPS was detected by qRT-PCR . **P< 0.01 vs. normal group. All data were presented as mean ± SD. n = 3.
Figure 2. Up-regulation of LEMD1-AS1 promotes proliferation, inhibits apoptosis, and reduces cell cycle arrest of chondrocytes treated with LPS. (a) qRT-PCR was performed to evaluate the LEMD1-AS1 expression in LPS-treated chondrocytes transfected with pc-LEMD1-AS1. (b) The viability of LPS-treated chondrocytes transfected with pc-LEMD1-AS1 was assessed by CCK-8 assay at indicated times. (c) The proliferation of LPS-treated chondrocytes transfected with pc-LEMD1-AS1 was evaluated by EdU assay. (d) The expression levels of proliferation-related proteins in LPS-treated chondrocytes transfected with pc-LEMD1-AS1, including PCNA and Ki-67, were evaluated by a Western Blot assay. (e) The cell cycle distribution of LPS-treated chondrocytes transfected with pc-LEMD1-AS1 was evaluated by flow cytometry analysis. (f) The expression levels of cell cycle-related proteins in LPS-treated chondrocytes transfected with pc-LEMD1-AS1, including Cyclin A1, Cyclin B1, Cyclin D2 and p27, were evaluated by a Western Blot assay. (g) The cell apoptosis of LPS-treated chondrocytes transfected with pc-LEMD1-AS1 was evaluated by flow cytometry analysis. (h) The expression levels of cell apoptosis-related proteins in LPS-treated chondrocytes transfected with pc-LEMD1-AS1, including Bax, Bcl-2, Cleaved-caspase-3 and Cleaved-caspase-9, were evaluated by Western Blot **P< 0.01 vs. control group, ##P< 0.01 vs. pc-NC + LPS group. All data were presented as mean ± SD. n = 3.
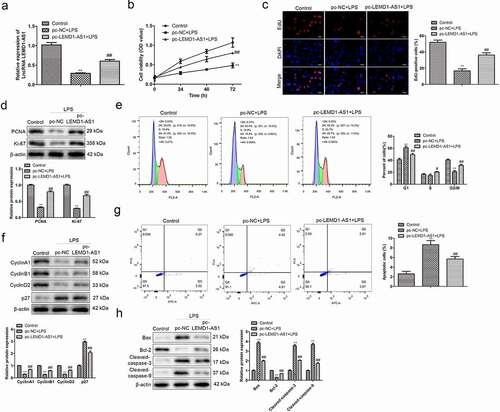
Figure 3. Up-regulation of LEMD1-AS1 ameliorates inflammatory responses of chondrocytes treated with LPS. The secreted levels of (a) TNF-α, (b) IL-1β and (c) IL-6 in LPS-treated chondrocytes transfected with pc-LEMD1-AS1 were determined by ELISA. (d) The cells expression of proteolytic enzymes like MMPs, and ADAMTS and even terminal differentiation of chondrocytes when the LEDM1-AS1 treated. *P< 0.05 vs. control group, #P< 0.05 vs. pc-NC + LPS group. All data were presented as mean ± SD. n = 3.
Figure 4. Regulatory relationship between LEMD1-AS1 and miR-944. (a) The candidate miRNAs regulated by LEMD1-AS1 were predicted. (b) The binding sites between LEMD1-AS1 and miR-944. (c) Dual-luciferase reporter analysis was employed to validate the coactions between LEMD1-AS1 and miR-944. **P< 0.01 vs. NC mimic group. (d) The expression of miR-944 in LPS-treated chondrocytes transfected with sh-LEMD1-AS1 was determined by qRT-PCR . **P< 0.01 vs. sh-NC group. (e) Relative enrichment of LEMD1-AS1 in chondrocytes was detected by RNA pull down. **P< 0.01 vs. IgG. (f) The expression of miR-944 in cartilage tissues of OA patients was detected by qRT-PCR . **P< 0.01 vs. normal group.All data were presented as mean ± SD. n = 3.
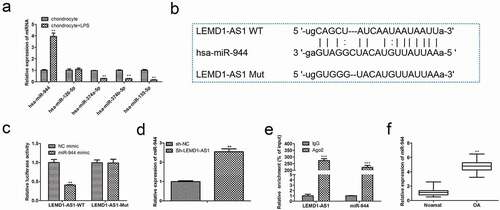
Figure 5. Down-regulation of miR-944 promotes proliferation, inhibits apoptosis, and reduces cell cycle arrest of chondrocytes treated with LPS. (a) qRT-PCR was performed to evaluate the miR-944 expression in LPS-treated chondrocytes transfected with miR-944 inhibitor. (b) The viability of LPS-treated chondrocytes transfected with miR-944 inhibitor was assessed by CCK-8 assay at indicated times. (c) The proliferation of LPS-treated chondrocytes transfected with miR-944 inhibitor was evaluated by EdU assay. (d) The expression levels of proliferation-related proteins in LPS-treated chondrocytes transfected with miR-944 inhibitor were evaluated by a Western Blot assay. (e) The cell cycle distribution of LPS-treated chondrocytes transfected with miR-944 inhibitor was evaluated by flow cytometry analysis. (f) The expression levels of cell cycle-related proteins in LPS-treated chondrocytes transfected with miR-944 inhibitor were evaluated by a Western Blot assay. (g) The cell apoptosis of LPS-treated chondrocytes transfected with miR-944 inhibitor was evaluated by flow cytometry analysis. (h) The expression levels of cell apoptosis-related proteins in LPS-treated chondrocytes transfected with miR-944 inhibitor were evaluated by a Western Blot assay. **P< 0.01 vs. control group, ##P< 0.01 vs. NC inhibitor + LPS group. All data were presented as mean ± SD. n = 3.
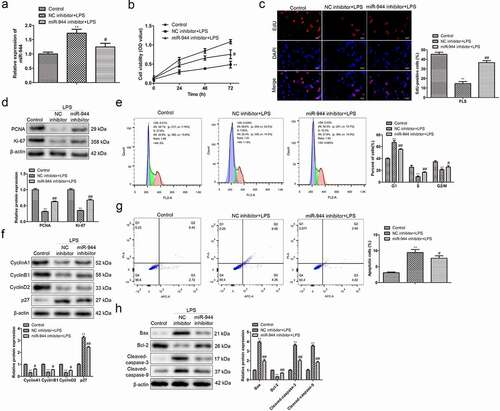
Figure 6. PGAP1 acts as a target of miR-944. (a) The possible downstream targets of miR-944 were predicted by bioinformatics tools. (b) Putative binding sites between miR-944 and PGAP1. (c) Dual-luciferase reporter analysis was employed to validate the interactions between miR-944 and PGAP1. **P< 0.01 vs. NC mimic group. (d) The expression of PGAP1 in chondrocytes with miR-944 inhibitor was determined by qRT-PCR. **P< 0.01 vs. NC inhibitor group. (e) The expression of PGAP1 in cartilage tissues of OA patients was detected by qRT-PCR. **P< 0.01 vs.normal group.All data were presented as mean ± SD. n = 3.
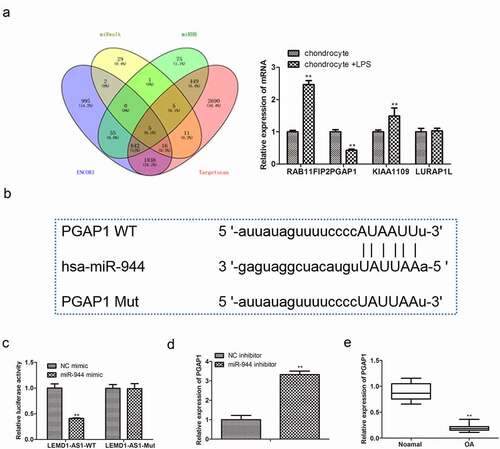
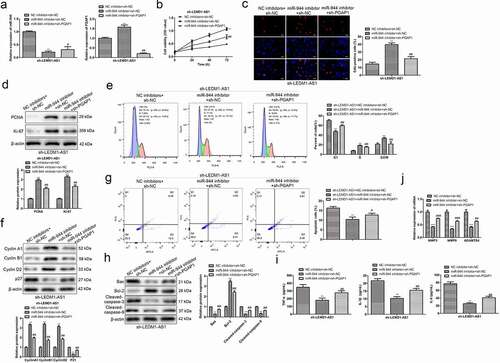
Figure 7. LEMD1-AS1 regulates proliferation, cell apoptosis and cycle, and inflammatory responses of LPS-treated chondrocytes by modulating miR-944/PGAP1 axis. (a) Transfection efficiency of LPS-treated chondrocytes was evaluated by qRT-PCR. (b) The viability of LPS-treated chondrocytes after transfection was assessed by a CCK-8 assay. (c) The proliferation of LPS-treated chondrocytes after transfection was evaluated by EdU assay. (d) The expressions of proliferation-related proteins in LPS-treated chondrocytes after transfection were evaluated by a Western Blot assay. (e) The cell cycle of LPS-treated chondrocytes after transfection was evaluated by flow cytometry analysis assay. (f) The expressions of cell cycle-related proteins in LPS-treated chondrocytes after transfection were evaluated by a Western Blot assay. (g) The cell apoptosis of LPS-treated chondrocytes after transfection was evaluated by flow cytometry analysis assay. (h) The expressions of cell apoptosis-related proteins in LPS-treated chondrocytes after transfection were evaluated by a Western Blot assay. (i) The secreted levels of TNF-α, IL-1β and IL-6 in LPS-treated chondrocytes after transfection were determined by an ELISA assay. (j) The cells expression of proteolytic enzymes like MMPs, and ADAMTS after transfection were evaluated by a Western Blot assay when the LEDM1-AS1 treated. **P< 0.01 vs. NC inhibitor + sh-NC group, #P< 0.05, ##P< 0.01 vs. miR-944 inhibitor + sh-NC group. All data were presented as mean ± SD. n = 3.