Figures & data
Figure 1. Celastrol inhibits VEGF-induced HRMEC proliferation and migration. (a-b) Flow cytometry analysis of apoptosis in HRMECs treated with indicated concentrations of celastrol. (c–e)The effects of celastrol (0.01, 0.1, 0.25, 0.5 μM) on 10 ng/ml VEGF-induced migration and angiogenic potential in HRMECs were evaluated with the wound healing assay (c) and tube formation (d) and aortic ring (e) assays. (f-g) Effects of celastrol on VEGF-induced proliferation and migration of HRMECs evaluated with the RTCA proliferation (f) and migration (g) assays. (h-i) Analysis of cell proliferation by immunofluorescence detection of PCNA (red) in HRMECs treated with celastrol (0.01, 0.1, 0.25, 0.5 μM). Nuclei were stained with DAPI (blue). Scale bar, 100 μm. Data are shown as mean ± SEM (n = 6 per group). NS, not significant. *P < 0.05, VEGF group vs control group; #, $,£P < 0.05, 0.1 μM, 0.25 μM, 0.5 μM celastrol vs VEGF group.
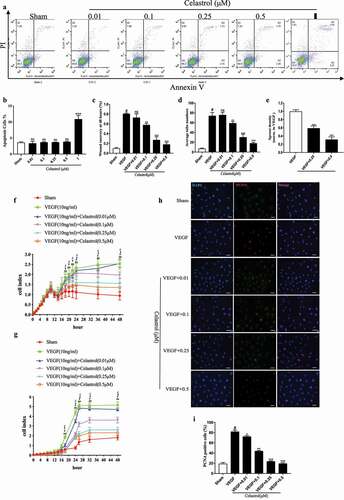
Figure 2. Celastrol inhibits hypoxia-induced VEGF and HIF-1α expression in vitro. (a, b) VEGF and HIF-1α protein levels determined by western blotting in HRMECs exposed to hypoxic conditions with or without celastrol (0.5 μM) treatment at 6, 12, 24, and 48 h; β-actin was used as a loading control. (c, d) VEGF (c) and HIF-1α (d) mRNA expression levels in HRMECs determined by qRT-PCR and normalized to β-actin level. (e, f) Representative immunofluorescence images (e) and quantification (f) of HIF-1α expression (red) in HRMECs. Nuclei were stained with DAPI (blue). Scale bar, 100 μm. Data are shown as mean ± SEM (n = 6 per group). NS, not significant. *P < 0.05, **P < 0.01, ***P < 0.001, #vs control group; *vs hypoxia group.
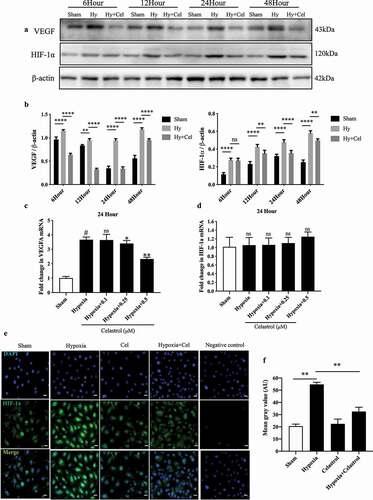
Figure 3. Celastrol blocks angiogenesis in vivo by inhibiting HIF-1α/VEGF pathway activation. (a) Representative images of hematoxylin-eosin (HE) staining in retinal tissue sections (top; scale bar, 200 μm), IB4 immunolabeling in whole-mount retinal tissue specimens (middle; scale bar, 500 μm), and high-magnification views (bottom, scale bar, 100 μm). (b, c) Western blot analysis of VEGF, HIF-1α, and PCNA protein levels in retinal tissues samples (left) and corresponding densitometric analysis (right); β-actin was used as the loading control. (d, e) HIF-1α (d) and VEGF (e) mRNA levels in retinal tissues determined by qRT-PCR and normalized to β-actin level. (f) Representative immunofluorescence images of HIF-1α (green) and VEGF (red) expression in retinal tissue sections. Nuclei were stained with DAPI (blue). Scale bar, 20 μm. Data are shown as mean ± SEM (n = 8 per group). NS, not significant. #vs control group; *P < 0.05, **P < 0.01, ***P < 0.001 vs hypoxia group.
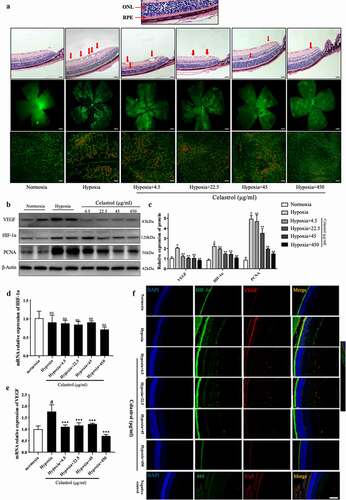
Figure 4. Celastrol reverses hypoxia-induced glial cell imbalance and increased inflammatory cytokine levels in the retina. (A–H) IL-1β, IL-6, TNF-α, MCP-1, MMP-9, COX-2, ICAM-1, and VCAM-1 mRNA levels in retinal tissue were determined by qRT-PCR and normalized to β-actin level. (I) Representative immunofluorescence images of IB4 (green) and glial fibrillary acidic protein (GFAP; red) or ionized calcium-binding adapter molecule (Iba)1 (red) expression in retinal tissue sections. Nuclei were stained with DAPI (blue). Scale bar, 20 μm. Data are shown as mean ± SEM (n = 8 per group). NS, not significant. #vs control group; *P < 0.05, **P < 0.01, ***P < 0.001 vs hypoxia group.
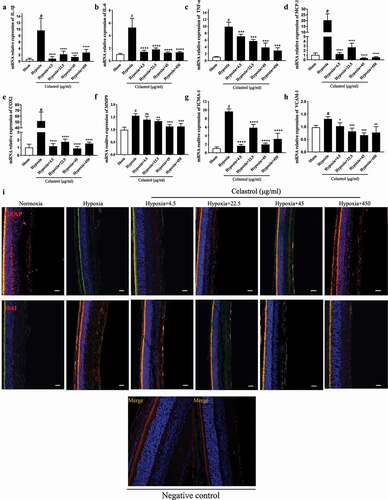
Figure 5. Celastrol promotes miR-17 expression in HRMECs and suppresses HIF-1α/VEGF signaling. (a) Identification of HIF-1α and VEGF as target genes of miR-17 using TargetScan software. (b) miR-17-5p levels in HRMECs determined by qRT-PCR. (c) Effect of miR-17-5p inhibitor treatment in HRMECs. (d–g) mRNA levels of HIF-1α (e, g) and VEGF (d, f) under normoxia and hypoxia following treatment with miR-17-5p inhibitor. (h-k) Migratory and angiogenic potential of HRMECs evaluated with the wound healing (h, j) and tube formation (i, k) assays, respectively. Scale bar, 200 μm. Data are shown as mean ± SEM (n = 6 per group). NS, not significant. #vs control group; *P < 0.05, **P < 0.01, ***P < 0.001.
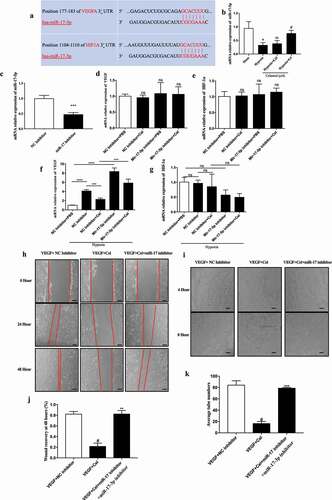
Figure 6. Inhibition of miR-17 reverses the effect of celastrol on angiogenesis and inflammatory cytokine release in vivo. (a) miR-17-5p levels in retinal tissues determined by qRT-PCR. (b–d) Effects of miR-17-5p antagomir (b), and HIF-1α (d) and VEGF (c) mRNA levels in retinal tissue. (e) Representative images of IB4 expression (green) in whole-mount retinal tissue specimens. Scale bar, 500 μm. (f–m) IL-1β, IL-6, TNF-α, MCP-1, MMP-9, COX-2, ICAM-1, and VCAM-1 mRNA levels in retinal tissue determined by qRT-PCR and normalized to β-actin level. (n, o) Western blot analysis of VEGF, HIF-1α, and PCNA protein levels in retinal tissue (left) and corresponding densitometric analysis (right). β-Actin was used as the loading control. Data are shown as mean ± SEM (n = 6 per group). NS, not significant. #vs control group; *P < 0.05, **P < 0.01, ***P < 0.001.
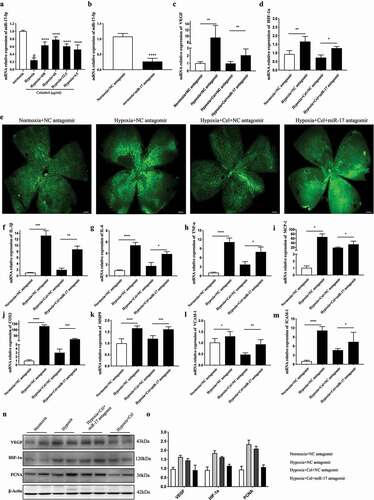
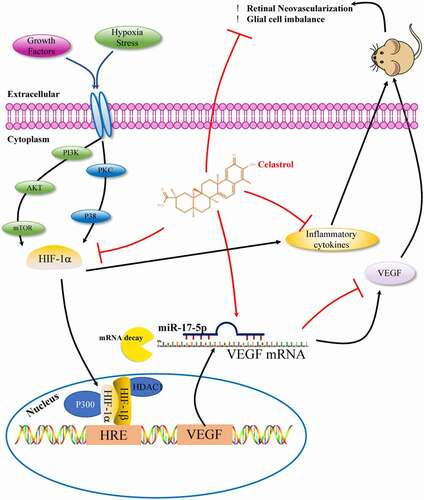
Figure 7. Effect of celastrol on hypoxia-induced retinal angiogenesis.