
Figures & data
Figure 1. circFCHO2 expression was elevated in GC, associating with poor outcome.
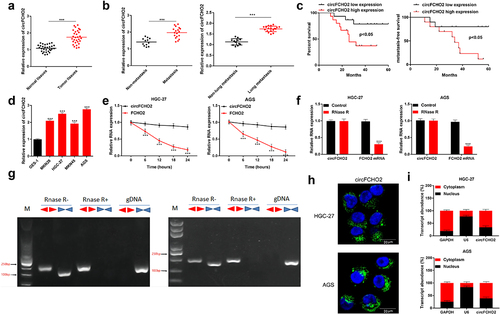
Figure 2. circFCHO2 silencing weakened the proliferation, invasion, angiogenesis and stem cell characteristics of GC cells.
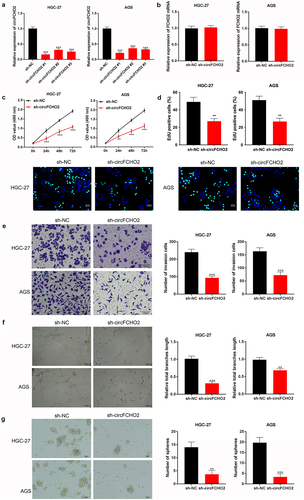
Figure 3. circFCHO2 exerted as a sponge of miR-194-5p.
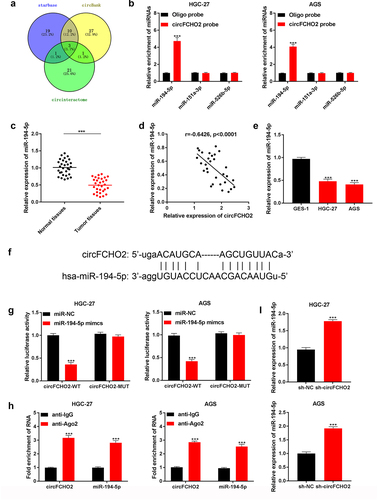
Figure 4. miR-194-5p knockdown partially reversed the inhibition of circFCHO2 silencing on the malignant phenotype of GC cells.
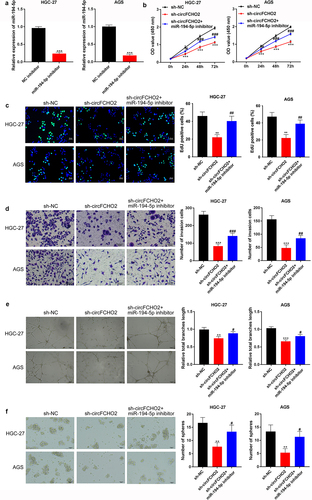
Figure 5. circFCHO2 promoted the activity of the JAK1/STAT3 pathway by sponging miR-194-5p.
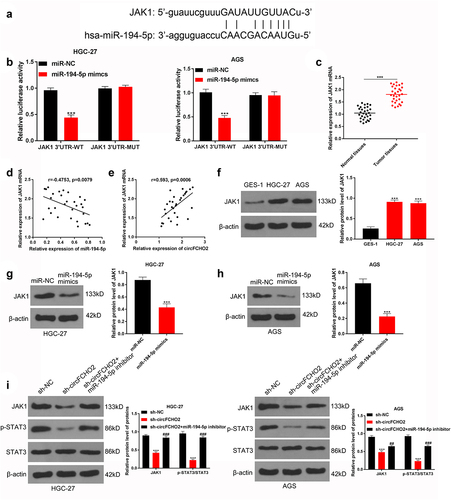
Figure 6. JAK1 overexpression partially reversed the inhibition of miR-194-5p on the malignant phenotype of GC cells.
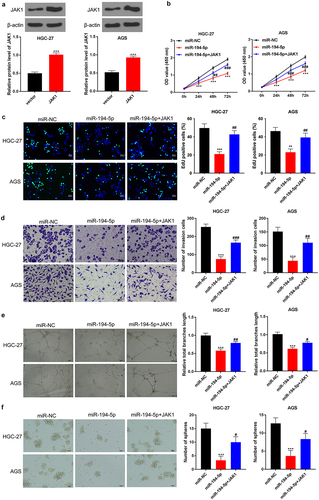
Figure 7. circFCHO2 silencing weakened the in vivo growth and lung metastasis of GC.
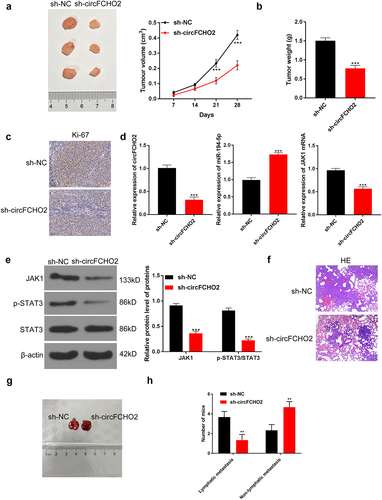
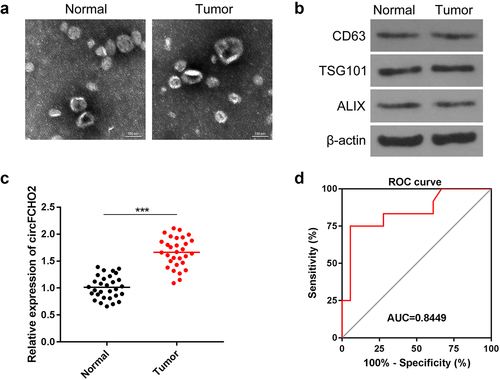
Figure 8. circFCHO2 in serum exosomes was a sensitive and effective biomarker for the diagnosis of GC.
Supplemental Material
Download Zip (15.3 MB)Data availability statement
All the data used to support the findings of this study are included within the article.