Figures & data
Figure 1. Identification of up-regulated metabolism-related genes in CRC. (a) Volcano plots of GSE39582 gene expression profile. Based on this criterion (adjusted P-value < 0.05 and |log2FC| > 1), the green and red dots indicate down- and up-regulated genes in volcano plots, respectively. (b) In 41 normal tissues and 473 CRC samples, expression matrices of 48 upregulated metabolism-related genes were then clustered in unsupervised hierarchy in the TCGA database. Green and red indicated lower and higher expression levels between genes, respectively.
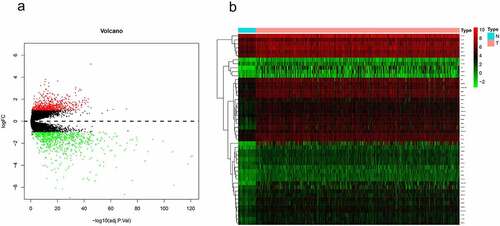
Figure 2. Critical gene identification for CRC diagnosis. (a) In the TCGA database, we filtered out the top 20 genes based on their AUC values. (b, c) Sensitivity and specificity of CTPS1 as a diagnostic biomarker for CRC assessed by ROC curves in TCGA database and GSE39582 dataset, respectively.
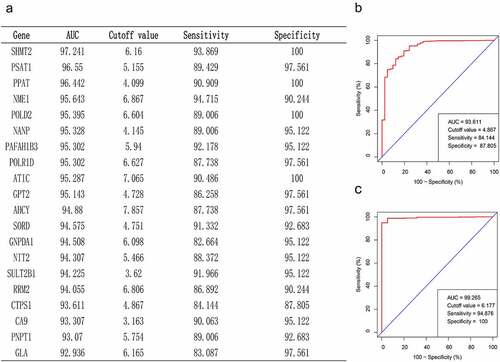
Figure 3. The mechanism of CTPS1 in CRC. (a) GO enrichment analysis. MF, CC and BP terms were used for the molecular function, cellular components and biological processes. The y-axis reflected the number of significant enrichment pathways. x-axis reflected the number of genes, and different colors reflected different P values. (b) KEGG pathway enrichment analysis. y-axis and x-axis reflect significant enrichment pathways and enrichment abundance, respectively. The color and size of the spots reflect the various P values and the number of target genes enriched in the relevant pathways, respectively.
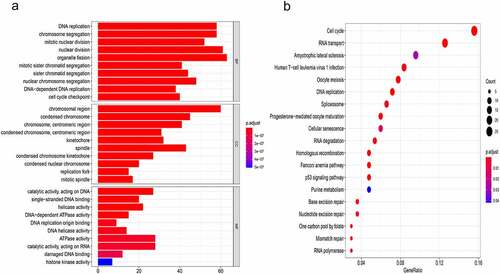
Figure 4. CTPS1 promotes the proliferation and metastasis of CRC cells. (a) CTPS1 expression was higher in SW480, RKO and HCT116 cells than in normal FHC cell line. (b) The levels of CTPS1 protein in CRC cells transfected with CTPS1 shRNA. (c, d) CCK-8 assay showed that the viability of RKO and HCT116 cells in the NC group was significantly higher than that in the shCTPS1 group. (e) Transwell assay revealed that cell metastasis was significantly suppressed in the shCTPS1 group. (f) Colony formation analysis were made to test the cell proliferation of RKO and HCT116 cells. (g, h) Quantitative analysis of transwell experiments and Colony formation experiments, respectively. (*p < 0.05, **p < 0.01).
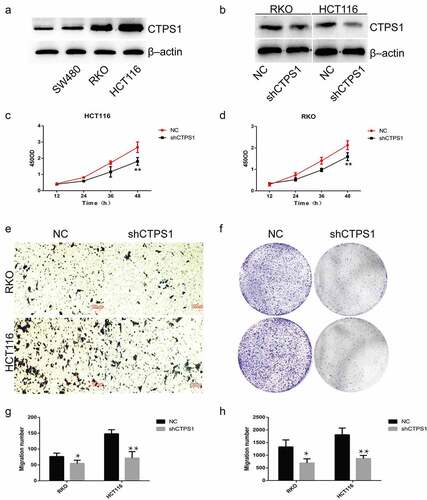
Figure 5. CTPS1 promoted the progression of CRC cells through the p53 pathway. (a) GSEA indicated that CTPS1 was associated with the p53 signaling pathway. X-axis was each gene sorted and Y-axis was the corresponding enrichment score. There was a crest in the graph and the crest was the enrichment score. NES stood for normalized ES and FDR q-value stood for p-value adjusted by multiple assumption testing. (b-f) Co-expression assay forecasts the correlation coefficients of CTPS1 with cell cycle molecules CCNB1, RRM2, GTSE1, CDK2 and CHEK2 (cor>0.5). (g, h) The RT-PCR assay showed that the shCTPS1 group inhibited the expression of GTSE1 and CDK2 compared with the NC group. (*p < 0.05, **p < 0.01,**p<0.001).
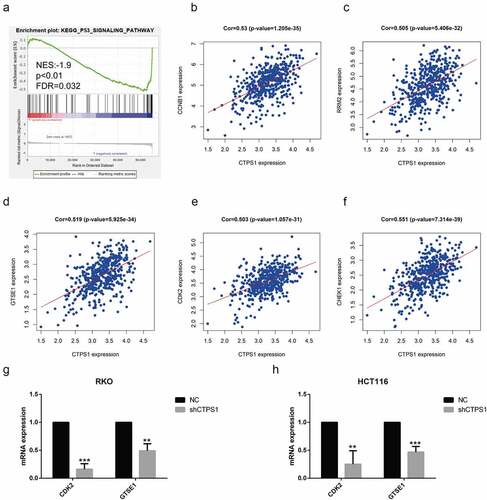
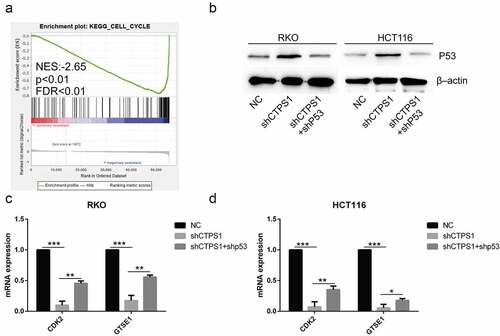
Figure 6. Related mechanisms of CTPS1. (a) GSEA enrichment analysis found that CTPS1 was involved in the regulation of cell cycle. The legend was described as . (b) Western blot assay showed that the shCTPS1 group promoted the expression of p53 protein, while shCTPS1+ shP53 group decreased the expression of p53 compared with the shCTPS1 group. (c) The RT-PCR assay showed that the shCTPS1 group inhibited the expression of GTSE1 and CDK2, and shCTPS1+ shP53 group attenuated the inhibitory effect of shCTPS1 group on GTSE1 and CDK2. (*p < 0.05, **p < 0.01, *** p < 0.001)。.