
Figures & data
Table 1. DLGAP1-AS2 expression and NSCLC patients’ clinicopathological characteristics.
Figure 1. DLGAP1-AS2 was an upregulated lncRNA in NSCLC. (a) Based on the lncRNA microarray data (GSE138172), heatmap demonstrated the numerous deregulated lncRNAs in the NSCLC tissue as compared to normal tissue. (b) In NSCLC and normal cell lines, expression of DLGAP1-AS2 was detected using RT-qPCR. (c) In NSCLC samples, DLGAP1-AS2 level was detected using RT-qPCR as compared to the normal adjacent tissue. (d) Survival rate analysis showed the lower survival rate of NSCLC patients with high DLGAP1-AS2 levels, while the higher survival rate of NSCLC patients with low DLGAP1-AS2 levels. Data are expressed as mean ± SD. **p < 0.01; *p < 0.05.
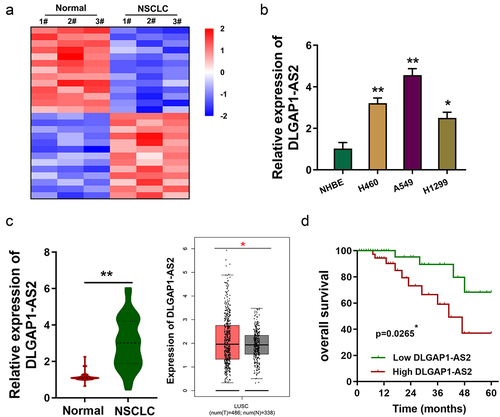
Figure 2. MeRIP-Seq revealed the m6A modification of DLGAP1-AS2. (a, c) MeRIP-Seq revealed the m6A peaks density in NSCLC cells, including 5’-UTR, coding region (CDS) and 3’-UTR. (b) The significant m6A motif for the m6A peaks was GGAC. (d) MeRIP-Seq showed that there was a remarkable m6A modification site in the 3’-UTR of DLGAP1-AS2. (e) Genomic analysis displayed the sequences of DLGAP1-AS2 3’-UTR containing m6A site (AGAC). (f) The motif of METTL3 targeting DLGAP1-AS2 m6A site.
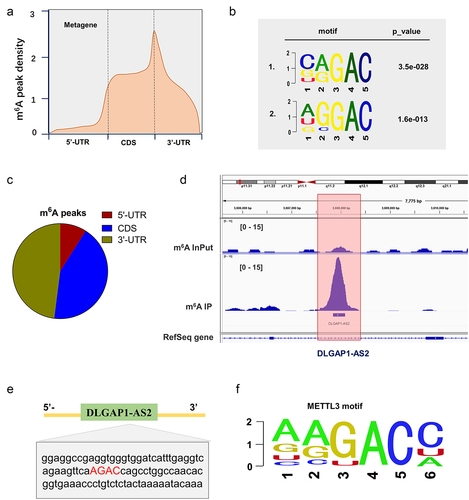
Figure 3. METTL3 enhanced the stability of DLGAP1-AS2 in m6A-dependent manner. (a) GEPIA dataset revealed the positive correlation within METTL3 and DLGAP1-AS2 in LUSC (Lung squamous cell carcinoma, http://gepia.cancer-pku.cn/). (b) The METTL3 protein was detected in NSCLC cells upon METTL3 overexpression transfection. (c, d) The m6A modification levels were detected using m6A RNA Methylation Quantification Kit (Colorimetric). (e, f) RNA stability analysis revealed the RNA remaining of DLGAP1-AS2 in H1299 cells and A549 cells treated by Act D (actinomycin D, 1 μg/m). LncRNA DLGAP1-AS2 was determined by qRT-PCR assay. *p < 0.05.
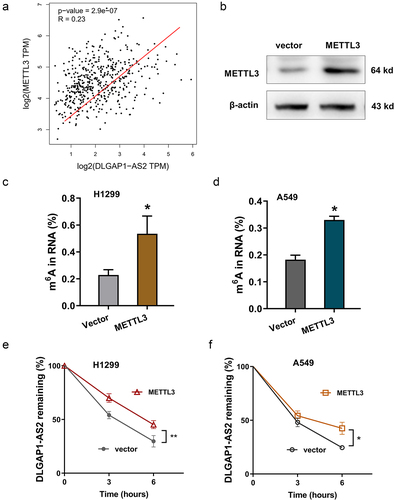
Figure 4. DLGAP1-AS2 promoted the aerobic glycolysis of NSCLC. (a) Detection of DLGAP1-AS2 levels by qRT-PCR in NSCLC cell lines (H1299, A549) respectively transfected with DLGAP1-AS2 overexpression plasmids or lentivirus shRNA. (b) Glucose uptake quantity was quantificationally detected using glucose uptake kit in H1299 and A549 cells. (c) Lactate production was quantificationally detected using lactate analysis kit. (d) ATP quantitative analysis was performed in H1299 or A549 cells. (e, f) The glycolysis levels of H1299 and A549 was detected using a seahorse analyzer. (g) In vivo animal experiments were performed to test the tumor neoplasm growth of NSCLC cells (A549) transfected with DLGAP1-AS2 silencing (sh-DLGAP1-AS2). The data are presented as the mean ± SD of three independent experiments. *p < 0.05, **p < 0.01.
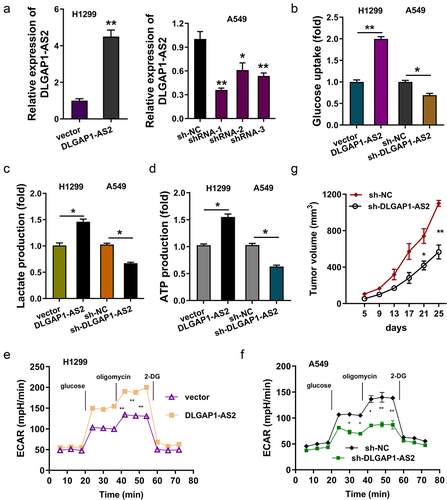
Figure 5. DLGAP1-AS2 targeted c-Myc via YTHDF1-dependent manner. (a) Co-localization analysis using fluorescence in situ hybridization (FISH) displayed the distribution of DLGAP1-AS2, YTHDF1 and c-Myc in A549 cells. (b) IGV viewer showed the m6A site in the c-Myc mRNA based on MeRIP-Seq data. (c) GEPIA database demonstrated the positive correlation within c-Myc and DLGAP1-AS2, or c-Myc with YTHDF1 (p < 0.001). (B) TCGA database illustrated the high-expression of c-Myc in LUSC (Lung squamous cell carcinoma, www.tcga.org/).
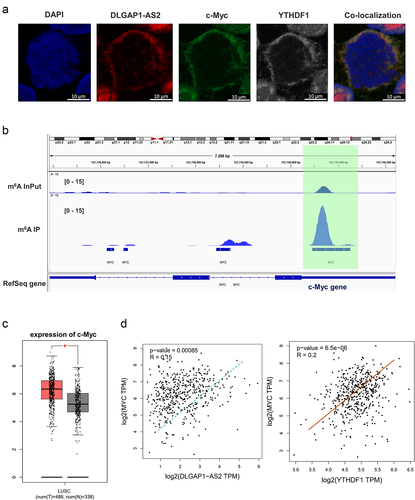
Figure 6. DLGAP1-AS2 promoted c-Myc mRNA stability through m6A-YTHDF1-dependent manner. (a) An m6A modification site in the 3’-UTR of c-Myc mRNA was discovered by MeRIP-Seq. The appropriate motif is CAGAC motif. (b) MeRIP-qPCR detected the m6A enrichment on c-Myc mRNA in NSCLC cells (H1299, A549) using m6A antibody and IgG control. (c) RNA immunoprecipitation (RIP) assays unveiled the c-Myc mRNA level precipitated by the anti-YTHDF1 antibody in NSCLC cells (H1299, A549) transfected with DLGAP1-AS2 overexpression (DLGAP1-AS2) and knockdown (sh-DLGAP1-AS2). (d) RT-qPCR detected the c-Myc mRNA level in NSCLC cells (H1299, A549) transfected with DLGAP1-AS2 overexpression and knockdown. (e) The levels of c-Myc expression in DLGAP1-AS2-overexpressing (DLGAP1-AS2), DLGAP1-AS2 knockdown (sh-DLGAP1-AS2) and their corresponding control were detected by qRT-PCR. NSCLC cells (H1299, A549) transfected NSCLC cells treated with actinomycin D (2 µg/mL). **p < 0.01 vs vector control.
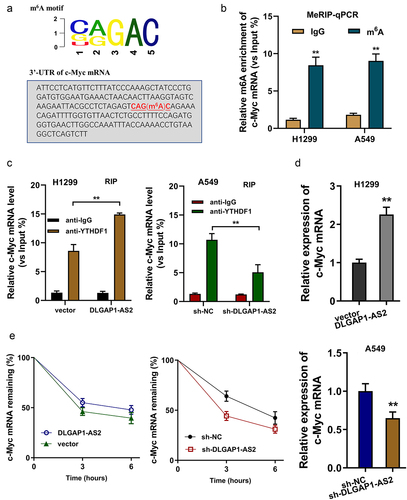
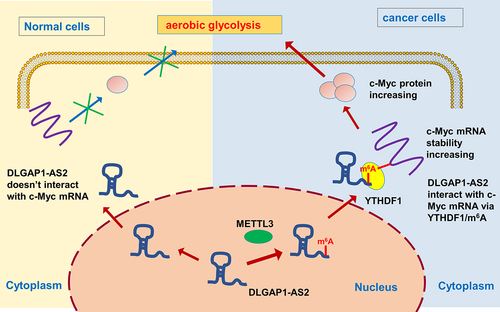
Figure 7. METTL3/DLGAP1-AS2/YTHDF1/m6A/c-Myc axis promotes the aerobic glycolysis of NSCLC.
Supplemental Material
Download MS Word (16.4 KB)Data availability statement
No research data shared.