Figures & data
Figure 1. Expression profile of lncRnas in lung adenocarcinoma tissues and normal adjacent tissues. (a) Heat map of top 20 differentially expressed lncRnas in lung adenocarcinoma tissues in comparison with normal adjacent tissues, UCA1 is screened out as up regulated in tumors. (b) Gene expression level of lncRNA-UCA1 in tissues analyzed by qRT-PCR, in which a significant increase was observed. **P < 0.01 compared to adjacent group. (c) Expression level of target gene in four lung cancer cell lines, obtained the highest expression from HCC-78. **P < 0.01 compared to HBE cells.
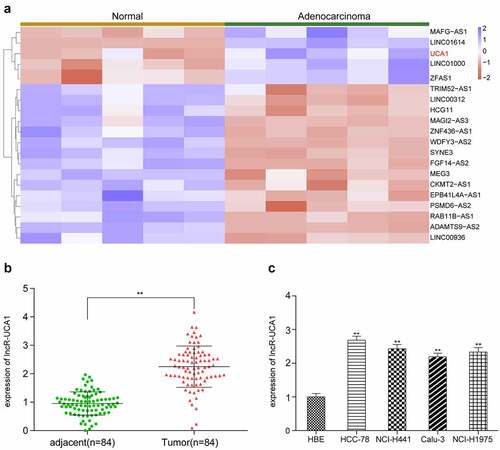
Figure 2. lncRNA-UCA1 effects on HCC78 cells proliferation and apoptosis. Relative gene expression level of lncRNA-UCA1 in siRNA-lncRNA-UCA1 transfected HCC-78 cells and siRNA-lncRNA-UCA2 transfected HCC-78 cells. The significant decline observed. **P < 0.01 compared to NC group. (b) CCK8 assay result represented by OD value at 490nm in linear graph. Silencing off lncRNA decreases cells proliferation. (c) Colony formation ability of HCC-78 cells with altered expression of lncRNA-UCA1. **P < 0.01 compared to NC group. (d) Apoptotic or living cells rate of HCC-78 cells with altered expression of lncRNA-UCA1. **P < 0.01 compared to NC group.
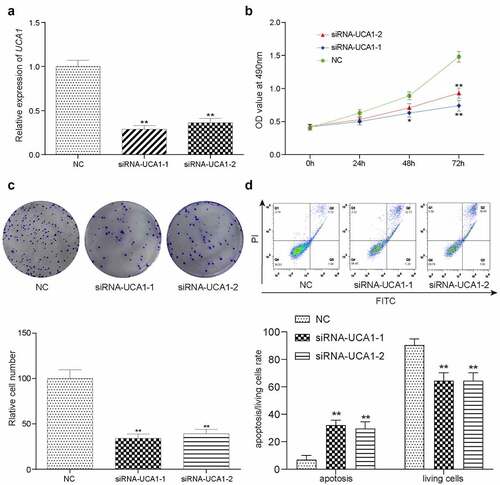
Figure 3. lncRNA-UCA1 effects on HCC78 cells migration and invasion abilities. the images and graph for wound healing assay towards HCC-78 cells after silencing lncRNA-UCA1, showing significant decrease in cells migration capability **P < 0.01. (b) Transwell assay of HCC-78 cells altered lncRNA-UCA1 expression, presenting decreased in invasion ability. (c) The expression levels of EMT-related markers in different treatment groups were detected by QRT-PCR. *P < 0.05, **P < 0.01.
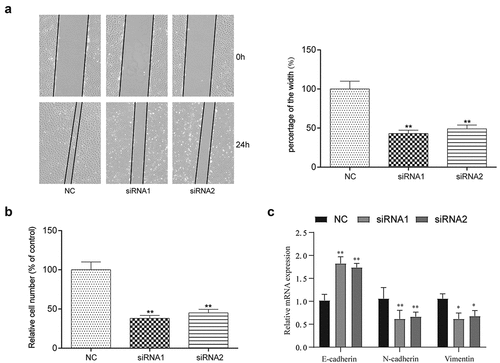
Figure 4. The targeting relationship between lncRNA-UCA1 and miR-383, and miRNA effects on tumor cells proliferation and apoptosis. (a) Target relationship between miR-383 and lncRNA-UCA1 was predicted by bioinformatics analysis. (b) Luciferase reporter assay validated the target relationship between lncRNA-UCA1 and miR-383, miR-383 mimics significantly inhibit the fluorescence activity of reporter vector carrying the wild-type lncRNA-UCA1, but not the mutant. **P < 0.01 compared with NC group. (c) Gene expression level of miR-383 in cancer and normal tissues, miR-383 has significant low expression in tumor. **P < 0.01 comparison with adjacent group. (d) qRT-PCR analysis for UCA1 silenced HCC-78 cells, the expression level of miR-383 increased significantly after transfection. **P < 0.01 compared with NC group. (e) Validation result of miR-383 mimics increase its expression and miR-383 inhibitor reduce its expression. **P < 0.01 compared with Control group. (f) HCC-78 cells proliferation ability after transfected with different plasmids. Inhibiting miR-383 expression showed the highest in cells proliferations. (g–h) Colony formation assay presented a phenomenon that inhibiting miR-383 was likely to has low apoptosis rate and transfected cells with miR-383 mimics increased apoptosis. **P < 0.01 compared with Control group.
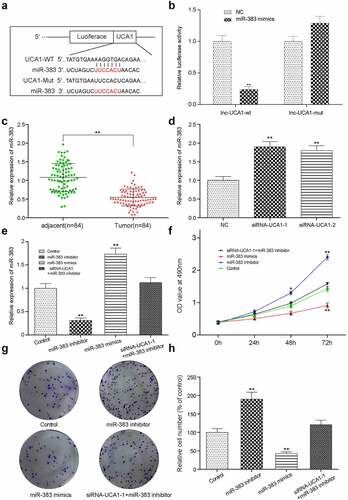
Figure 5. miR-383 effects on HCC78 cells migration and invasion abilities. (a)The images and graph for wound healing assay towards HCC-78 cells with miR-383 inhibitor, miR-383 mimics and siRna1+mir-383 inhibitor treatment. Showing a significant increase in cells migration capability from miR-383 inhibitor group. A decrease in miR-383 mimics was also appeared. **P < 0.01 compared with Control group. (b) the transwell assay towards HCC-78 cells for cells treated with same procedures mentioned above, the consistent result was obtained that cells number increased in miR-383 inhibitor group, and decreased in miR-383 mimics group. (c) the expression levels of EMT-related markers in different treatment groups were detected by QRT-PCR. **P < 0.01 compared with Control group.
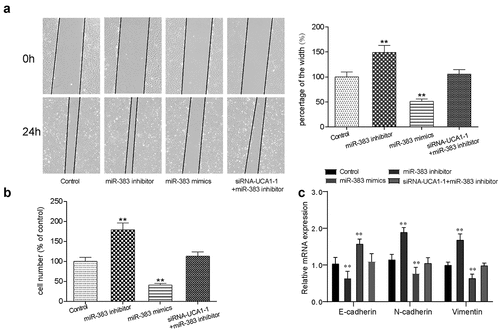
Figure 6. The targeting relationship between miR-383 and VEGFA. (a) Target relationship between miR-383 and VEGFA was predicted by bioinformatics analysis. (b) luciferase reporter assay validated the target relationship between VEGFA and miR-383, miR-383 mimics significantly inhibit the fluorescence activity of reporter vector carrying the wild-type lncRNA-UCA1, but not the mutant. **P < 0.01 compared with NC group. (c) Gene expression level of VEGFA in cancer and normal tissues, VEGFA has significant low expression in tumor. **P < 0.01 comparison with adjacent group. (d) Gene expression level of VEGFA in HCC-78 cells after performed with siRNA1, miR-383 inhibitor, miR-383 mimics and siRna+mir-383 inhibitor transfections. VEGFA expression reduced significantly in siRna1group and miR-383 inhibitor group, while inclined in miR-383 mimics group. **P < 0.01 comparison with control group. (e–f) Protein expression level of VEGFA was evaluated in same condition above, the consistent result was acquired. **P < 0.01 comparison with control group.
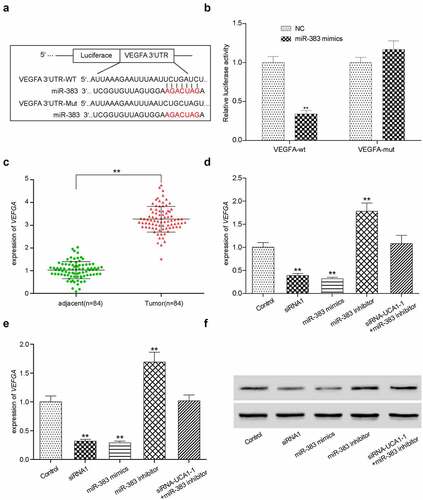
Figure 7. In vitro effects of VEGFA. (a) Validation of silencing off VEGFA gene decreased its expression. **P < 0.01 comparison with si-NC group. (b) VEGFA silenced HCC-78 cells has lower proliferations in comparison with normal group. (c) Colony formation assay presented a phenomenon that inhibiting VEGFA was likely to has low transfected cells. (d) The wound healing assay towards HCC-78 cells with altered VEGFA gene expression. Showing a significant decrease in cells migration capability from si-VEGFA group. **P < 0.01 comparison with si-NC group. (e) The transwell assay towards HCC-78 cells with altered VEGFA gene expression. A consistent decrease in cells invasion ability in si-VEGFA group. **P < 0.01 comparison with si-NC group.
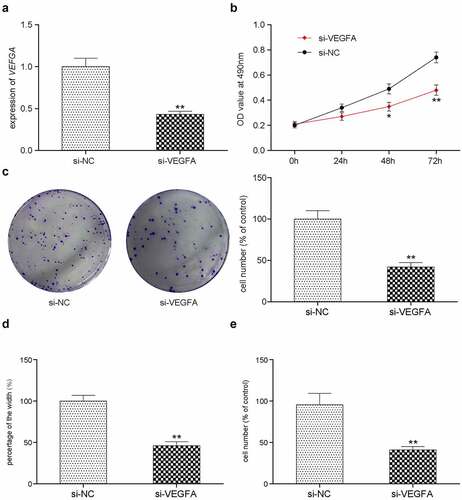
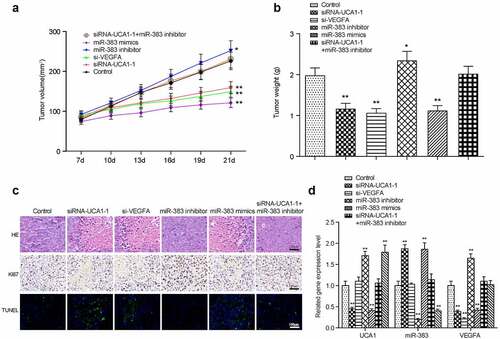
Figure 8. Xenograft mice model assay. the linear graph exhibited the tumor volumes in different groups (miR-383 inhibitor, miR-383 mimics, siRna1+mir-383 inhibitor, si-VEGFA, siRNA1, Control). (b) Tumors weight in groups mentioned above. (c) HE staining, KI67 staining and TUNEL staining in tumor tissues of each treatment group. (d) The comprehensive study of the gene expression levels of lncRNA-UCA1, miR-383 and VEGFA in mice tumor tissues. N = 5, *P < 0.05, ** P < 0.01 comparison with Control group.