Figures & data
Figure 1. Experimental design and schedule. (a) the assessment of tumor growth at each time point. (b) the arrangement of the rechallenge test. MWA: microwave ablation.
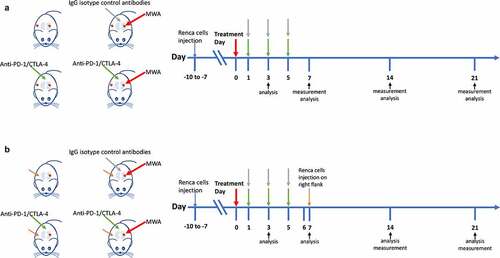
Figure 2. MWA+ICI combination treatment obviously suppresses tumor growth rate. (a) the volume of untreated tumors within 21 days. (b) Specific growth rate (SGRs) of tumors in control, MWA, ICI, and MWA+ICI groups. *P<.05, **P<.01. MWA: microwave ablation; ICI: immune checkpoint inhibitor; SGR: specific growth rate.
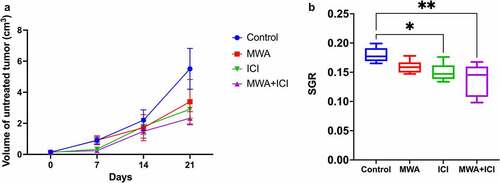
Table 1. Growth of untreated tumors.
Figure 3. MWA+ICI combination treatment increases CD8+T-cell percentage and decreases Treg cell population. (a) CD8+T-cell percentage in control, MWA, ICI, and MWA+ICI groups. (b) Treg population by group. (c) MDSC population by group. (d) CD8+T/Treg ratio by group. (e) IFN-γ levels by group. *P<.05, **P<.01, ***P<.001, ****P<.0001.
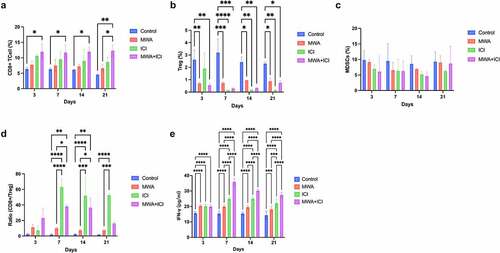
Figure 4. Detection of CTLA4, PD-L1 and PD-1 expression levels in distant tumors. (a) Mean density of CTLA4 expression in tumor tissues of control, MWA, ICI, and MWA+ICI groups. (b) Mean density of PD-L1 expression by group. (c) Mean density of PD-1 expression by group. *P<.05, **P<.01. MWA: microwave ablation; ICI: immune checkpoint inhibitor.
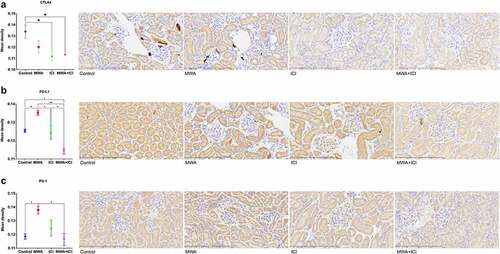
Figure 5. Upon rechallenge test, MWA+ICI combination treatment boosts tumor rejection. (a) Volumes of distant tumors in control, MWA, ICI, and MWA+ICI groups. (b) SGRs by group. (c) CD8+T-cell percentage by group. (d) Treg cell population by group. (e) MDSC population by group. (f) CD8+T/Treg ratio by group. (g) IFN-γ levels by group. *P<.05, **P<.01, ***P<.001, ****P<.0001.
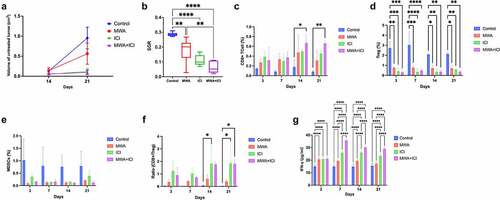
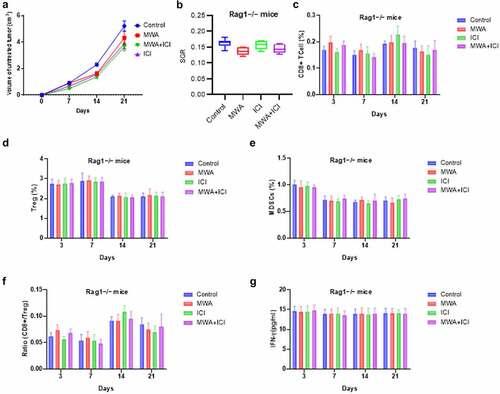
Figure 6. Immunodeficient mice exhibits no tumor rejection after the combination therapy. (a) Volumes of tumors in Rag1−/− mice of control, MWA, ICI, and MWA+ICI groups at the time point of day 0, day 7, day 14, and day 21. (b) SGRs of tumors in Rag1−/− mice from above four groups. (c) CD8+T-cell percentage by group. (d) Treg cell population by group. (e) MDSC population by group. (f) CD8+T/Treg ratio by group. (g) IFN-γ levels by group.