Figures & data
Table 1. The clinical characteristics of the studied gastric cancer patients.
Figure 1. The expression level of SNHG22 is associated with poor survival ability of patients. (a) TCGA gastric cancer tissue sample data were analyzed using GEPIA. (b) KM-plotter analysis was utilized to evaluate the relationship between SNHG22 expression in gastric cancer cases and the patient’s overall survival rate. (c) Relative SNHG22 expression in collected clinical samples was detected by qRT-PCR analysis. (d) Kaplan – Meier survival curve analysis of the high- and low- SNHG22 -expression groups were evaluated. (e) Relative SNHG22 expression in gastric cell lines and normal gastric epithelial cell line (GSE-1) was detected by qRT-PCR analysis. All experiments were done in triplicates and experimental data are presented as the mean ± SD with a statistical significance level of P < 0.05 (**P < 0.01).
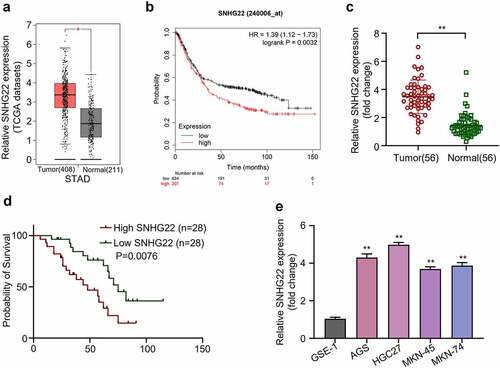
Figure 2. Silencing SNHG22 inhibits cell proliferation, induces apoptosis, and reduces in vivo tumor growth in gastric cancer (a) qRT-PCR analysis was used to detected the relative SNHG22 expression after the knockdown. (b) Measurement of cell viability of gastric cancer cell lines after SNHG22 knockdown using CCK8 assay. (c) Colony formation experiment was used to evaluate the proliferation of the GC cells after SNHG22 knockdown. (d) and (e) Detection of gastric cancer cell migration and invasion ability after SNHG22 knockdown using transwell assay. (f) and (g) In vivo tumor growth experiment was used to evaluate tumor growth ability after silencing SNHG22. Experimental data are presented as mean ± SD of three different experiments with a significance level defined as P < 0.05 (**P < 0.01).
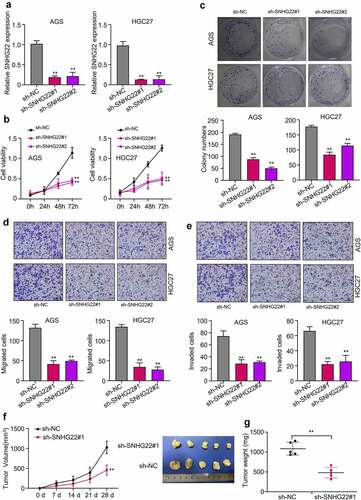
Figure 3. SNHG22 sponges miR-101-3p. (a) qRT-PCR was used to detection of the subcellular location of SNHG22 in gastric cancer cell lines. (B) Starbase prediction of SNHG22 target miRNA. (C) Dual-luciferase reporter assay was utilized to confirm SNHG22-miR-101-3p binding ability. (D) Biotinylated RNA pull-down assay was performed to verify the relationship of SNHG22 and miR-101-3p. (E) RIP-qRT-PCR analysis Was used to verify the relationship of SNHG22 and miR-101-3p. (F) qRT-PCR analysis was performed to detected the expression of miR-101-3p in gastric cancer cell lines after SNHG22 knockdown. The experimental data are presented as the mean ± SD of at least three independent experiments. The significance level is defined as P <0.05 (**P < 0.01).
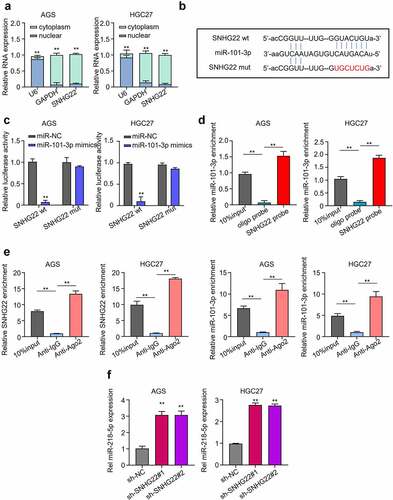
Figure 4. miR-101-3p directly targets E2F2. (a) Bioinformatics was used to predicted the miR-101-3p target gene. (b) Dual-luciferase reporter assay experiment was performed to confirmed the prediction. (c) qRT-PCR analysis was utilized to detect the expression of E2F2 mRNA in gastric cancer cell lines after transfection with miR-101-3p mimics. (d) Western blot analysis was utilized to detect the protein expression of E2F2 after transfection with miR-101-3p mimics. (e) GEPIA analysis was used to evaluate the E2F2 expression level in gastric cancer tumor samples from the TCGA database. (f) the relationship between E2F2 expression level in gastric cancer tissue samples and patient’s overall survival probability was evaluate by KM-plotter analysis. (g) Relative E2F2 expression in collected clinical samples was detected by qRT-PCR analysis. (h) the expression of SNHG22 was positively correlated with E2F2 in GC clinical samples. The experimental data are shown as mean ± SD of three independent experiments. The significance level is defined as P <0.05 (**P < 0.01).
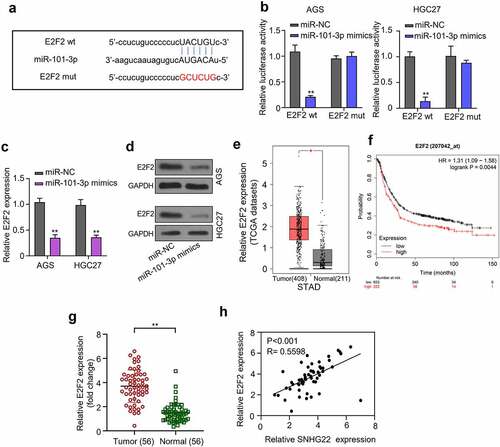
Figure 5. SNHG22 regulates gastric cancer cell progression via the miR-101-3p/e2f2 axis. (a) Western blot analysis was performed the protein expression of E2F2 in gastric cancer cell lines after transfection. (b) CCK-8 assay was utilized to detect the cell viability after transfection. (c) Colony formation assay was performed the proliferation of gastric cancer cell lines transfected with miR-101-3p inhibitor or E2F2 overexpression. (d) and (e) Gastric cancer cell line migration and invasion ability were evaluated by Transwell assay. Data are presented as the mean ± SD of at least three independent experiments. The significance level is defined as P <0.05. (**P <0.01 vs sh-NC; ^^P <0.01 vs sh-SNHG22#1).
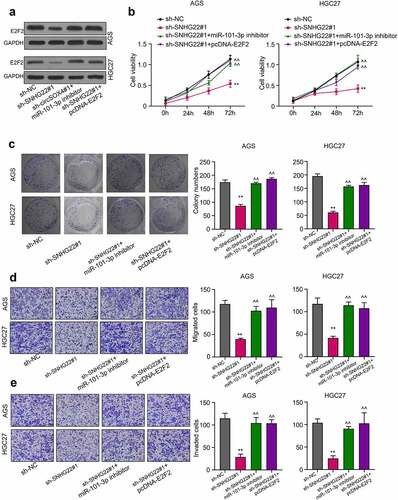
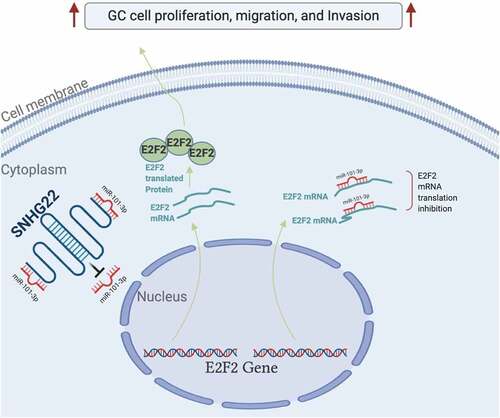
Figure 6. A schematic representation of the lncRNA SNHG22 mechanism of gastric cancer cell regulation was showed in the current study.