Figures & data
Figure 1. RNA-seq identified that Hemopexin (Hpx) is a significantly upregulated gene in lung tissues of COPD mice upon TS treatments. (A) The scheme of CS plus LPS exposures and TS treatments in mice. Male C57BL/6J mice were exposed to cigarette smoke for 60 days. Mice with LPS intranasally inhalation (7.5 μg/mouse in 50μL saline) at the 1st and 14th day were exposed to CS from day 0 to 60 except for the days giving LPS. Mice were then intraperitoneally injected with TS (10 mg/kg per day) or vehicle for 15 days. n=5 for the Vehicle and TS groups. (B-C) Lung sections were subjected to H&E staining. Airway or peri-airway inflammation was assessed in at least 3 high-powered fields per mouse of the indicated three groups. (D-F) Several lung function parameters, including resistance index (RI)(D), chord compliance (E), and FEV100/FVC ratio (F) were measured. (G) The numbers of total cells and macrophages in mouse BALF were counted in three groups. Control mice, without treatments. (H) The levels of inflammatory cytokines including IL-6, IL-8, TNF, and IL-1β in mouse BALF were measured by ELISA. n=5 for each group. *P<0.05; **P<0.01; ***P<0.001, between the indicated groups.
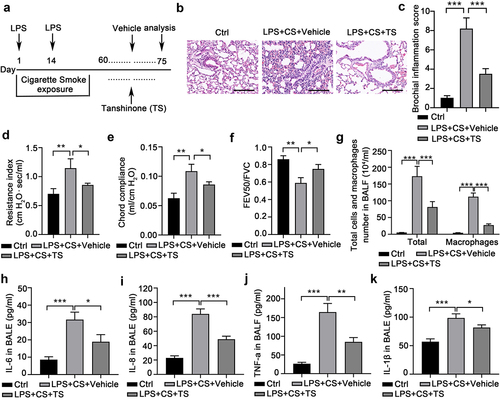
Figure 2. RNA-seq identified that Hemopexin (Hpx) is a significantly upregulated gene in lung tissues of COPD mice upon TS treatments.
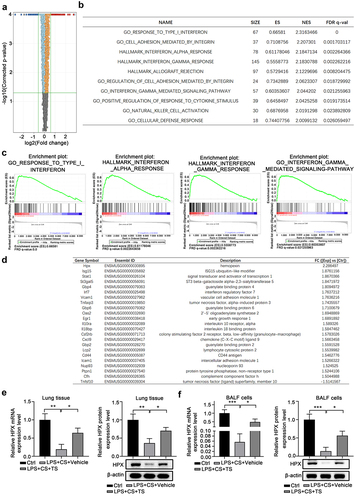
Figure 3. TS treatments attenuated the diminished proliferation, enhanced apoptosis, and increased inflammatory cytokine production caused by CS and LPS in normal human lung cells and mouse macrophages. (a) TS treatment increased HPX/Hpx expression in normal human lung BEAS-2B cells and RAW164.7 mouse macrophages. Cells were stimulated with the indicated concentrations of TS for 48 h, and HPX/Hpx mRNA levels were quantitated by qPCR. (b)Cigarette smoke extract (CSE) plus LPS treatments decreased HPX/Hpx expressions in BEAS-2B cells and RAW164.7 cells. (c) Cells were left un-treated (Ctrl), treated with CSE plus LPS and vehicle, or CSE plus LPS and TS, or TS only, for 48 h. The mRNA levels of HPX/Hpx in four groups of cells were measured by qPCR. (d-f) The proliferation (d) and apoptosis (e-f) of four groups of BEAS-2B or RAW264.7 cells were measured by CCK-8 assay and Annexin V staining, respectively. Representative flow profile is shown (f), and the apoptosis rates (% of Annexin V+ cells) were summarized (e). (G) Production of IL-6 and IL-8 in culture supernatant of BEAS-2B cells in the indicated four groups was determined by ELISA. (h) Production of TNF and IL-1β in culture supernatant of RAW164.7 cells in the indicated 4 groups was determined by ELISA. n=5 for each group. *P<0.05; **P<0.01; ***P<0.001, between the indicated groups.
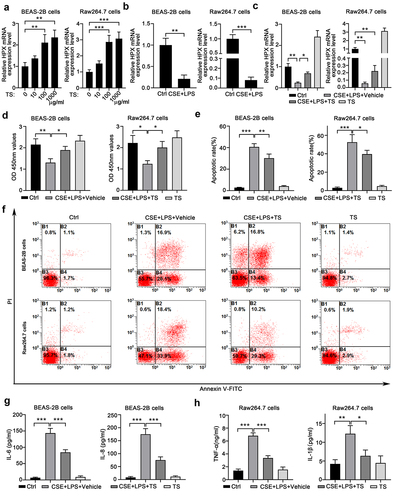
Figure 4. TS treatments mitigated the oxidative stress caused by CSE and LPS in normal human lung cells and mouse macrophages.
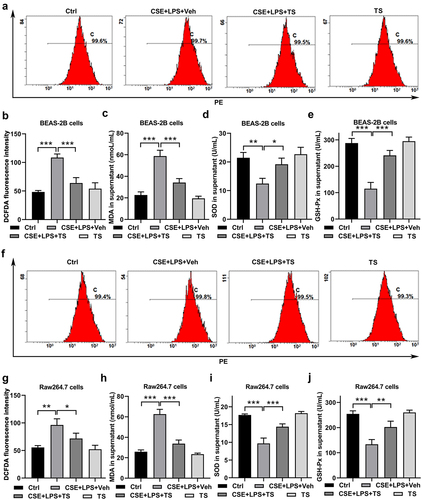
Figure 5. HPX/Hpx knockdown attenuated the effects of TS on suppressing inflammation and oxidative stress in human lung cells and mouse macrophages. (a-d) BEAS-2B cells and RAW264.7 cells were infected with lentivirus expressing HPX/Hpx targeting shRNA. At 48 h after infections, cells were harvested for further analyses. (a)The relative mRNA levels of HPX/Hpx were quantitated by qPCR. (b-d) Cell proliferation (b) and apoptosis (c-d) in BEAS-2B and RAW264.7 cells after HPX knockdown were measured by CCK-8 and Annexin V staining. Representative flow profiles are shown (c), and apoptotic rates (% of Annexin V+ cells) were summarized (d). (e-k) Control or HPX/Hpx-knockdown cells were exposed to CSE and LPS. IL-6/IL-8 production from BEAS-2B cells (e), and TNF/IL-1β production from RAW264.7 cells (f) were measured. (g-h) ROS levels in the control and HPX/Hpx knockdown cells were measured by flow cytometry. Representative flow profiles of DCFDA staining are shown (h). (i-k) The MDA levels (i), SOD activities (j), and GSH-Px activities (k) were measured in control and HPX/Hpx knockdown cells. (l-q) Control and HPX/Hpx knockdown cells were exposed to CSE and LPS with the pre-treatment with vehicle or TS. (l) After treatments, IL-6/IL-8 production from BEAS-2B cells, and TNF/IL-1β production from RAW264.7 cells were measured. (m-n) ROS levels in the four groups were measured by DCFDA staining. Representative flow profiles are shown (n). (o-q) The MDA levels (o), SOD activities (p), and GSH-Px activities (q) were measured in the four groups. n=3 for each group. *P<0.05; **P<0.01; ***P<0.001, between the indicated groups.
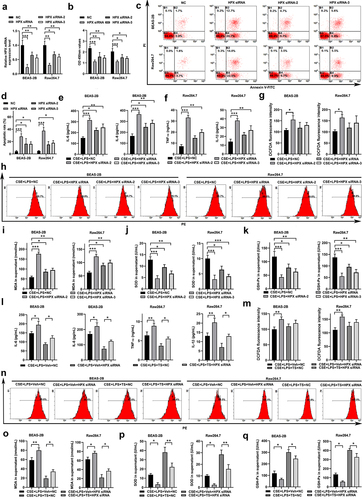
Figure 6. HPX overexpression slightly reduced the inflammation and oxidative stress caused by CSE and LPS in lung cells and macrophages. (a) The relative mRNA levels of HPX/Hpx in BEAS-2B cells and RAW264.7 cells at 48 h after lentivirus-mediated HPX/Hpx overexpression were determined by qPCR. (b-j) Control cells or HPX/Hpx-overexpressing cells were left untreated or exposed to CSE and LPS, and cells at 48 h after challenge were harvested for further analyses. (b-d) Cell proliferation (b) and apoptosis (c-d) in control and HPX-overexpressing BEAS-2B and RAW264.7 cells under control or CSE+LPS conditions were measured by CCK-8 and Annexin V staining. Representative flow profiles are shown (d). (e) Cytokine productions in control and HPX-overexpressing cells of the indicated groups were measured. (f-g) ROS levels by DCFDA flow staining in control and HPX-overexpressing cells of the indicated groups were measured. Representative flow profiles are shown (g). (h-j) The MDA levels (h), SOD activities (i), and GSH-Px activities (j) of control and HPX-overexpressing cells of the indicated groups were measured. n=3 for each group. *P<0.05; **P<0.01; ***P<0.001, between the indicated groups.
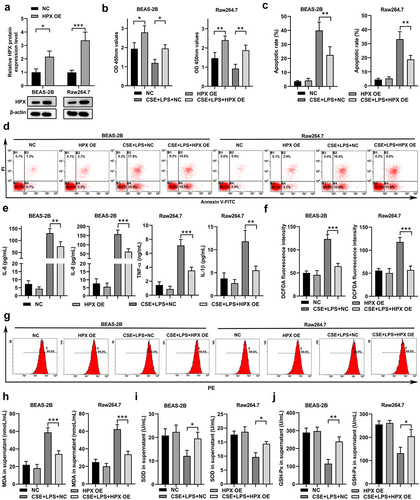
Figure 7. TS relieved the activation of the NF-κB signaling pathway and NLRP3 inflammasome pathway in lung cells and macrophages. (a) Lung tissues from control mice, vehicle-treated COPD mice and TS-treated COPD mice were subjected to western blot analyses. Representative bands are shown, and the relative protein levels of p-ERK and p-P65 were quantitated by densitometry. (b-d) BEAS-2B cells and RAW264.7 cells were left untreated, or challenged with CSE and LPS with pretreatments with vehicle or TS, or treated with TS only. (b-c) The relative protein levels of p-ERK and p-P65 in BEAS-2B cells (b) and RAW264.7 cells (c) were quantitated by western blot and densitometry. (d)The relative protein levels of cleaved-Caspase-1, Caspase-1, ASC, and NLRP3 in RAW264.7 cells were quantitated by western blot and densitometry. (e-f) BEAS-2B cells and RAW264.7 cells at 48 h after infection of control lentivirus or lentivirus expressing HPX/Hpx were further challenged with CSE and LPS. (e)The relative protein levels of p-ERK and p-P65 in the indicated BEAS-2B cells were quantitated by western blot and densitometry. (f)The relative protein levels of cleaved-Caspase-1, Caspase-1, ASC, and NLRP3 in the indicated RAW264.7 cells were quantitated by western blot and densitometry. n=3 for each group. *P<0.05; **P<0.01; ***P<0.001, between the indicated groups.
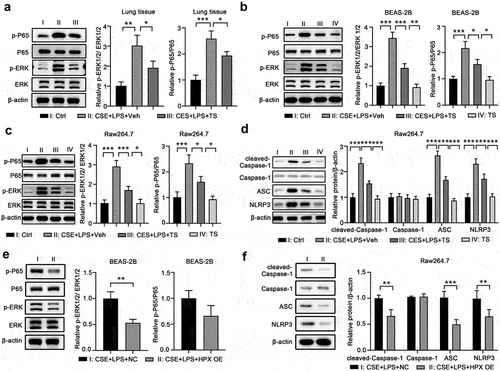
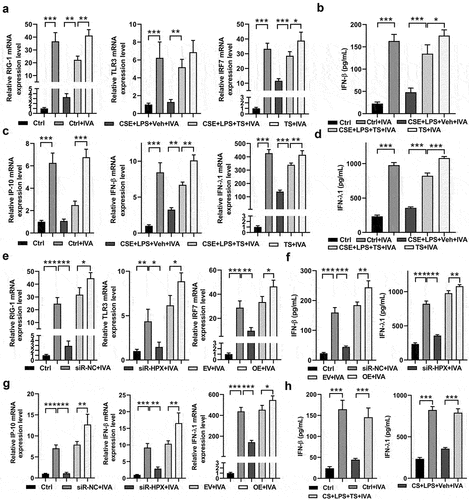
Figure 8. TS promoted IFN signaling and rescued impaired antiviral responses in human lung cells and COPD mice.