
Figures & data
Figure 1. Determination of the renal function in FADD-D and control mice. A, the humid weight of the kidney from FADD-D and control mice. B, the kidney/body weight ratio. C-G, the levels of 24-h urine volume (C), urine creatinine (D), urea nitrogen (E), urinary protein/24 h (F), and uric acid (G) of the serum in mice by using assay kits (n = 6, male mice aged 8 weeks). H, the number of blood cells were counted under microscopic by Giemsa staining of urine smears (n = 6, male mice aged 8 weeks). Data are presented as mean ± SEM of three independent experiments; *p <0.05, **p <0.01, ***p <0.001 compared with respective control.
Figure 2. Increased inflammation in the kidney of FADD-D mice. A, the mRNA expression levels of TLR4, myD88, and NF-κB. B, the protein expression level of TLR4/pNF-κB/myD88 signaling pathway. C, the mRNA expression levels of the inflammatory cytokines including IFN-γ, IL-6, TGF-β1, COX2, IL-1β and TNF-α measured by qPCR assay. D, the macrophage infiltration in the kidney (n = 6, male mice aged 8 weeks). Scale bar 50 μm. Data are presented as mean ± SEM, *p <0.05 compared with respective control.
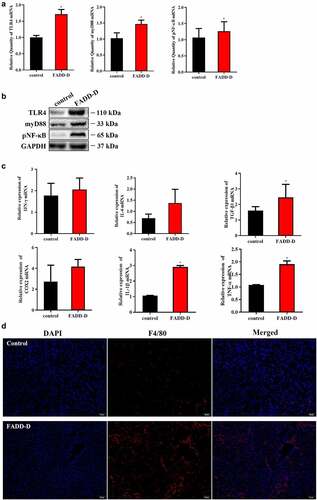
Figure 3. FADD-D mice might spontaneously develop IgA nephritis. A-J, Detection of IgA, IgG, IgM, C1q and C3 in serum (A-E) and kidney (F-J) of the mice. K, the profile of IgA deposition in the kidney detected by immunofluorescence (n = 6, male mice aged 8 weeks). Scale bar 10 μm. Data are presented as mean ± SEM, *p < 0.05, ***p < 0.001 compared with respective control.
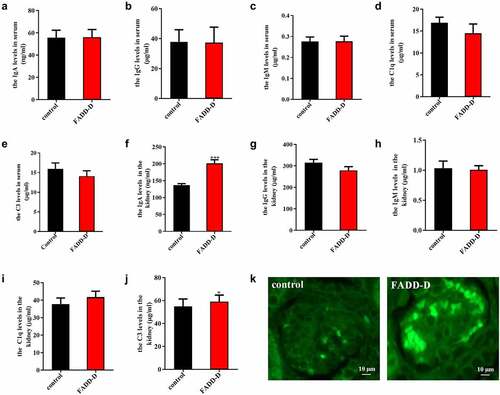
Figure 4. Proteomics analysis and Two-photon images. A-B, GeneGO pathway map showing changes in expression of proteins involved in the role of AVP in regulation of Aquaporin 2 and renal water reabsorption (A) and mTOR signaling pathway (B) upon FADD phosphorylation. The various proteins on this map are represented by different symbols (representing the functional class of the protein). Thermometers with blue or red shading next to symbols depict proteins identified in the present study: blue color represents proteins that were down-regulated in FADD-D renal tissue relative to control group; red color represents proteins that were up-regulated in FADD-D renal tissue relative to control group. C, Immunohistochemical analysis of CD31. Scale bar 50 μm. D, the state of glomerular capillaries after FITC injection under two-photon microscope (×400). Scale bar 75 μm.
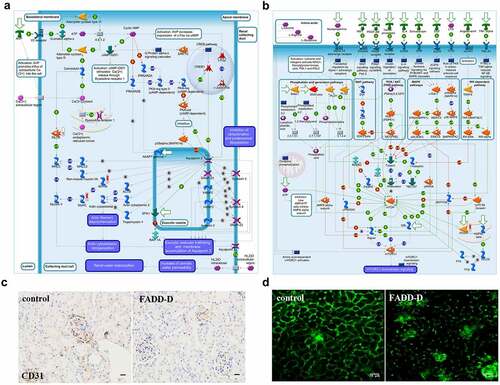
Figure 5. The effect of FADD phosphorylation on renal fibrosis in mice. A, H&E staining of mice kidney morphology. B, PASM staining. C, PAS staining. D, Masson staining. E-F, Immunohistochemical analysis of type IV collagen (E) and Ki67 (F). Scale bar 50 μm.
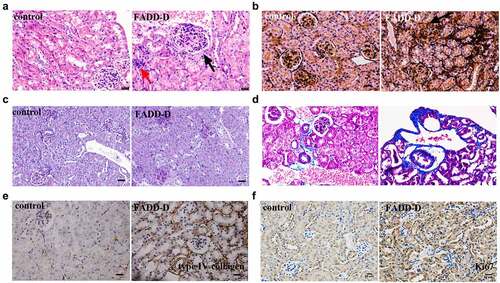
Figure 6. FADD phosphorylation accelerated EMT process by activating mTOR and TGF-β/Smad pathway. A, the mRNA levels of Vimentin, Snail, E-cadherin, N-cadherin, col a and TGF-β1. B, the protein expression levels of EMT markers (Fibronectin, N-cadherin, E-cadherin, Vimentin, Snail and ɑ-SMA). C, the expression levels of proteins (p-Smad2, p-Smad3, Smad2/3 and TGF-β1) involved in TGF-β/Smad signaling pathway. (Notice: The experiment in Fig. 6B was performed in the same experiment with Fig. 6C.) D, the expression levels of proteins (p-mTOR, P70S6K, p-GSK3β, p-AKT and AKT) involved in mTOR signaling pathway. E, the positive expression of Snail, N-cadherin, Vimentin, and Fibronectin were shown by immunofluorescence experiments. Scale bar 20 μm. Data are presented as mean ± SEM, *p <0.05 compared with respective control.
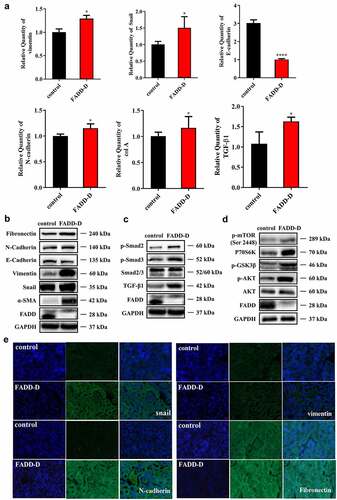
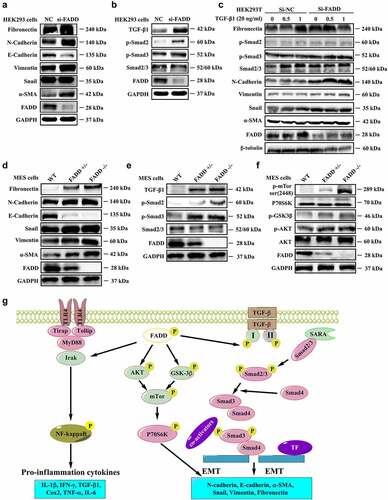
Figure 7. FADD knockdown or deficiency accelerated EMT process. A-B, After interfering with the expression of FADD in HEK293 cells, the expression level of EMT markers (A) and the expression level of proteins involved in TGF-β/Smad signaling pathway (B). (Notice: The experiment in Fig. 7A was performed in the same experiment with Fig. 7B.) C, After TGF-β1 stimulation (20 ng/ml), the activation degree of TGF-β pathway was investigated in HEK293 cells transfected with FADD siRNA. D-F, the expression level of EMT markers (D), proteins involved in TGF-β/Smad signaling pathway (E), and mTOR pathway (F) were also investigated by WB analysis using indicated antibodies in FADD-deficient MES cells. (Notice: The experiment in Fig. 7D was performed in the same experiment with Fig. 7E.) G, Schematic illustration of the potential mechanisms by which FADD phosphorylation promotes the development of renal fibrosis.
Supplemental Material
Download Zip (5.2 MB)Data availability statement
All data generated or analyzed during this study are included in this article.