
Figures & data
Table 1. Correlation between clinicopathological features and COL6A1 expression of the 71 BC patients in our cohort.
Table 2. Clinical information, efficacy evaluation, and COL6A1 expression of the 58 BC patients treated with Tislelizumab in our cohort.
Figure 1. The risk survival curve of the model based on the 4 ECM differentially expressed genes was closely related to the overall survival rate, and the survival rate of the high-risk group was worse than that of the low-risk group (p = 1.369e-05)(a). The ROC curve was established based on the model constructed by the 4 ECM differentially expressed genes, and the area under the curve (AUC) was 0.641(b).
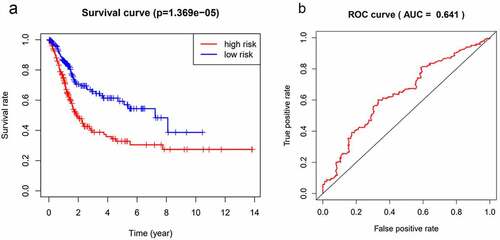
Figure 2. Based on the ECM differential expression gene, the model risk grouping and clinical correlation thermograms showed that the 4 genes with high expression had high risk and were closely related to T stage, N stage and grades of BC. *P <0.05; **P <0.01; ***P <0.001(a). Univariate Cox regression analysis showed that age, grade, T stage, N stage and model risk score were significantly correlated with survival rate of BC: age (HR = 1.029, CI:1.001–1.058, p < 0.05), stage (HR = 1.778, CI:1.243–2.543, p < 0.05), T stage (HR = 1.696, CI:1.149–2.504, p < 0.05), N stage (HR = 1.547, CI:1.177–2.033, p < 0.05), model risk score (HR = 2.325, CI:1.542–3.506, p < 0.05) (b). Multivariate Cox regression analysis showed that the score was an independent risk factor for predicting the prognosis of BC (HR = 2.462, CI:1.537–3.944, P < 0.05) (c).
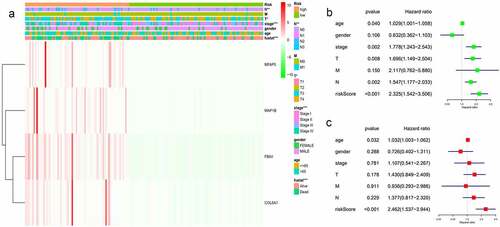
Figure 3. The STRING database showed that COL6A1 was a hub gene in protein–protein interaction network analysis (PPI) (a). COL6A1 was highly expressed in BC tissues, and COL6A1 expression was significantly higher in tumor tissues than in normal tissues in TCGA-BLCA cohort and GSE13507 cohort (p = 1.355e-04) (b). Survival analysis showed that the overall survival rate of patients with high COL6A1 expression in TCGA-BLCA cohort and GSE13507 cohort was poor (P = 0.044) (c).
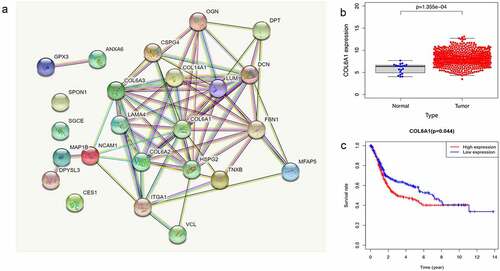
Figure 4. The protein expression levels of COL6A1 in our BC and normal tissues. Immunohistochemical staining results: a-normal tissue; b- positive staining; c-not metastatic tissues; d- distant metastasis tissues (antibody 17,023-1-AP, Proteintech Company, Chicago, USA).
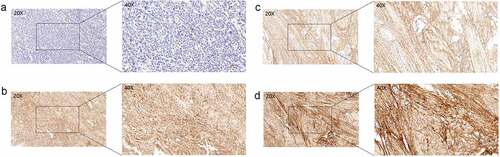
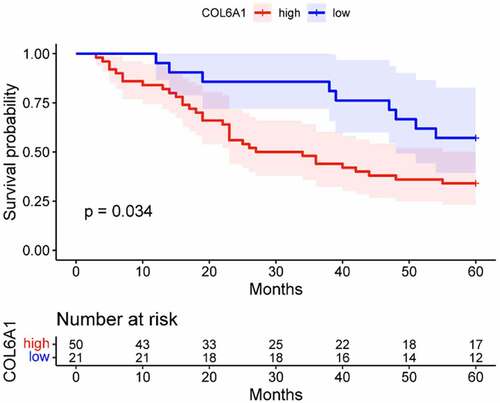
Figure 5. K-M survival analysis in our BC cohort showed that the overall survival time of COL6A1 high-expression group was poor (p = 0.034).
Supplemental Material
Download Zip (23.8 KB)Data availability statement
Data and materials supporting the results are available upon reasonable request from the corresponding author Yonghua Wang ([email protected]).