Figures & data
Figure 1. NAV2-AS5 is downregulated in OA tissue and LPS-stimulated chondrocyte. (a) Relative expression of NAV2-AS5 in OA tissue and normal tissue,*p < 0.05, OA tissue compared with the normal tissue. (b) Relative expression of NAV2-AS5 in LPS-treated chondrocyte and normal group. **P < 0.01 LPS-treated chondrocyte compared with the normal group.
Figure 2. Overexpression of NAV2-AS5 promotes proliferation and inhibits apoptosis in LPS-treated chondrocytes. (a) Relative expression of NAV2-AS5. (b) Cell viability detected by CCK-8 assay. (c) EdU-positive cells assessed by EdU staining. (d) The expression of PCNA and Ki-67. (e) The cell cycle was examined by flow cytometry analysis. (f) The expression of CyclinA1, CyclinB1, CyclinD1, and p27. (g) Cell apoptosis was assessed by flow cytometry. (h) The protein expression of Bax, Bcl-2, Cleaved-caspase-3, and Cleaved-caspase-9. **P < 0.01, pc-NC+LPS group compared with the control LPS group, #P < 0.05, ##P < 0.01 pc-NAV2-AS5+LPS compared with the control LPS group.
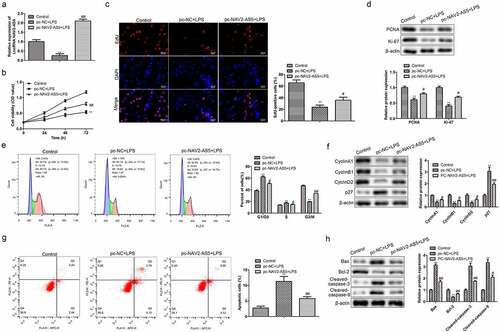
Figure 3. Overexpression of NAV2-AS5 inhibits the release of inflammatory factors in LPS-treated chondrocytes. (a–c). The content of TNF-α, IL-1β, and IL-6 was detected by ELISA. **P <0.01, pc-NC+LPS group compared with the control LPS group, #P <0.05, ##P <0.01 pc-NAV2-AS5+LPS compared with the control LPS group.
Figure 4. MiR-8082 targets 3’-UTR of NAV2-AS5. (a) The binding sites between miR-8082 and NAV2-AS5 were predicted by DIANA. (b) Luciferase reporter assay, **P <0.01, miR-8082 mimic group compared with the NC mimic group. (c) The expression of miR-8082 detected by qRT-PCR, **P <0.01, the sh-NAV2-AS5 group compared with the sh-NC group. (d) The enrichment of NAV2-AS5 and miR-8082, **P <0.01, Ago group compared with the IgG group. (e) The expression of miR-8082 was detected by qRT-PCR. (f) The correlation analysis between the expression of NAV2-AS5 and miR-8082. *P <0.05 OA group compared with the normal group.
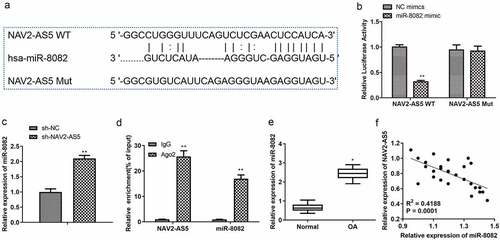
Figure 5. Knockdown of miR-8082 promotes cell proliferation, inhibits cell apoptosis, and releases inflammatory factors in LPS-treated chondrocytes. (a) Relative expression of miR-808. (b) Cell viability. (c) EdU-positive cells assessed by EdU staining. (d) The protein expression of PCNA and Ki-67.(e) The cell cycle. (f) The protein expression of CyclinA1, CyclinB1, CyclinD1, and p27.(g) Cell apoptosis. (h) The protein expression of Bax, Bcl-2, Cleaved-caspase-3, and Cleaved-caspase-9. I. The content of TNF-α, IL-1β, and IL-6 was detected by ELISA. **P <0.01, *P <0.05, NC inhibitor+lps compared with the control group; #P <0.05, ##P <0.01, miR-8082 inhibitor+lps compared with the control group.
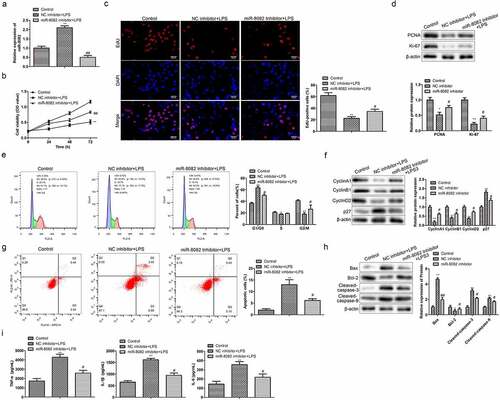
Figure 6. TNIP2 is a target gene of miR-8082. (a) The target genes of miR-8082 were detected by Bioinformatics. (b) The binding sites between miR-8082 and TNIP2. **P <0.01, *P <0.05 LPS-induced chondrocytes compared with the control chondrocytes group. (c) Luciferase reporter assay, **P <0.01, miR-8082 mimic group compared with the NC mimic group. (d) The mRNA expression of TNIP2, **P <0.01, miR-8082 inhibitor group compared with the NC inhibitor group. (e) The mRNA expression of TNIP2. *P <0.05, OA group compared with the normal group. (f) The correlation analysis between the expression of TNIP2 and miR-8082.
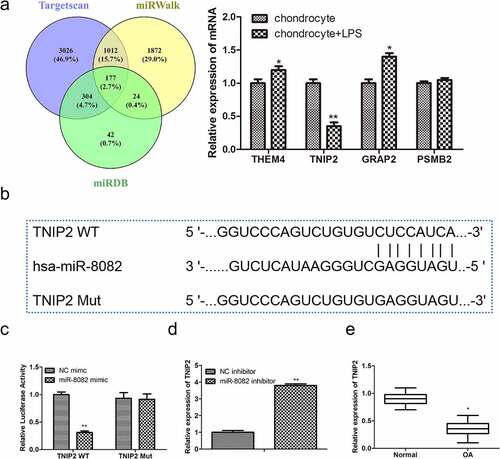
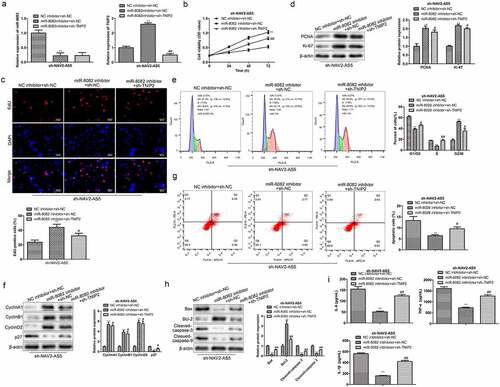
Figure 7. NAV2-AS5 modulates chondrocyte proliferation, migration and inflammat -ion via miR-8082/TNIP2 axis. (a) Relative expression of miR-8082 and TNIP2. (b) Cell viability. (c) EdU-positive cells assessed by EdU staining. (d) The protein expression of PCNA and Ki-67. (e) The cell cycle. (f) The protein expression of CyclinA1, CyclinB1, CyclinD1 and p27. (g) Cell apoptosis. (h) The protein expression of Bax, Bcl-2, Cleaved-caspase-3 and Cleaved-caspase-9. (i) The content of TNF-α, IL-1β, and IL-6. **P < 0.01, *P < 0.05, miR-8082 inhibitor+sh-NC group compared with the control group (NC-inhibitor+sh-NC), #P < 0.05, ##P < 0.01, miR-8082 inhibitor+sh-TNIP2 group compared with the control group (NC-inhibitor+sh-NC).