
Figures & data
Figure 1. Effect of zaltoprofen on the expression of PPARγ in H-EMC-SS cells at the mRNA (a) and protein (b) levels, as determined by qRT-PCR and western blot analyses, respectively. GAPDH was used as the housekeeping factor. (c) Effect of zaltoprofen on the expression of C/EBPα, C/EBPβ, C/EBPδ, and Krox20 mRNAs in H-EMC-SS cells, as determined by qRT-PCR. *p < 0.05, **p < 0.01. Error bars: ± SEM.
Figure 2. (a) Effects of zaltoprofen on the viability of H-EMC-SS cells as detected by the WST-8 assay. Cells were treated with various concentrations of zaltoprofen and the absorbance was measured at each time point. (b) Confirmation of knockdown efficacy of PPARγ by qRT-PCR. PPARγ mRNA expression was analyzed in H-EMC-SSshNT and H-EMC-SSshPPARγ cells (c) PPARγ dependency of the effect of zaltoprofen on cell viability. H-EMC-SSshNT and H-EMC-SSshPPARγ cells were treated with or without zaltoprofen for 96 h before the WST-8 assay. ***p < 0.001. Error bars: ± SEM.
Figure 3. (a) Representative photographs of H-EMC-SSshNT and H-EMC-SSshPPARγ cells with/without zaltoprofen treatment for 24 h in the EdU proliferation assay. Scale bar = 100 µm. (b) the ratio of EdU-positive cells (the number of red nuclei [EdU-positive] per number of blue nuclei [Hoechst 33,342-positive]). *p < 0.05, **p < 0.01, ***p < 0.001. Error bars: ± SEM.
![Figure 3. (a) Representative photographs of H-EMC-SSshNT and H-EMC-SSshPPARγ cells with/without zaltoprofen treatment for 24 h in the EdU proliferation assay. Scale bar = 100 µm. (b) the ratio of EdU-positive cells (the number of red nuclei [EdU-positive] per number of blue nuclei [Hoechst 33,342-positive]). *p < 0.05, **p < 0.01, ***p < 0.001. Error bars: ± SEM.](/cms/asset/9775a6bf-c984-4a9a-b57f-2405333ed94b/kccy_a_2166195_f0003_c.jpg)
Figure 4. Effects of zaltoprofen on the expression of p21, p27, and p53 in H-EMC-SSshNT and H-EMC-SSshPPARγ cells, as detected by western blot analyses. GAPDH was used as the housekeeping protein.
Figure 5. (a) Tumor growth curves for the EMC xenograft model with or without zaltoprofen treatment. Line graphs indicate the tumor volume at each time point after the initiation of treatment. The tumor growth was significantly inhibited by zaltoprofen (30 mg/kg) treatment *p < 0.05, Error bars: ± SEM.(b) Photographs of the excised tumors. Scale bar = 10 mm.
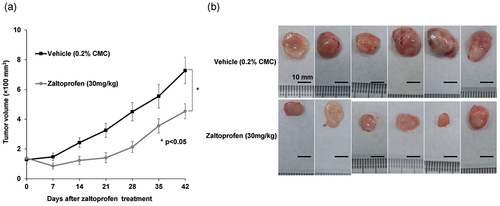
Figure 6. (a, b) Representative computed tomography images of the mice on the final day of treatment (42 days from treatment initiation). Arrows show the boundary of the tumors. (a) Vehicle (0.2% CMC, 30 mg/kg) treated group. (b) Zaltoprofen (30 mg/kg) treated group. Scale bar = 10 mm. Hematoxylin and eosin staining of the tumors in the (c) vehicle-treated and (d) zaltoprofen-treated groups. There were more necrotic scars in the zaltoprofen-treated tumor section. Scale bar = 100 µm.
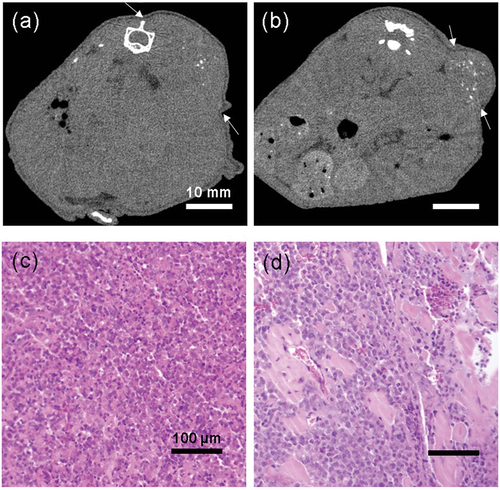
Figure 7. (a, b) Representative photographs of TUNEL-stained tumors. (a) Vehicle (0.2% CMC, 30 mg/kg) group. (b) Zaltoprofen (30 mg/kg) group. Scale bar = 100 µm. (c) Bar graphs indicate the average TUNEL-positive area (percentage of fluorescent area in the tumor region). TUNEL stained areas, showing apoptotic tissue, were significantly larger in the zaltoprofen treated tumors. *p < 0.05. Error bars: ± SEM. (d, e) Representative photographs of tumors immunohistochemically stained for Ki-67 in the (d) vehicle (0.2% CMC, 30 mg/kg) and (e) zaltoprofen (30 mg/kg) groups. Scale bar = 100 µm. (f) Bar graphs indicate the percentage of Ki-67-positive cells. Ki-67-positive cells were significantly lower in the zaltoprofen treated tumors. ***p < 0.001. Error bars: ± SEM.
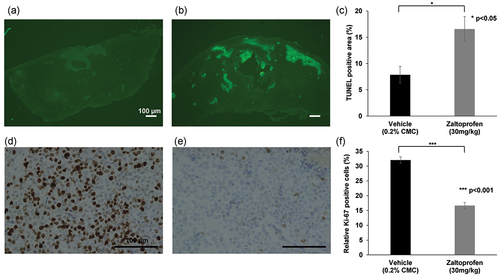
Figure 8. Changes in the pre- and post-treatment (42 days from treatment initiation) body weights of mice. Body weights of the mice significantly increased after 42 days in both groups. *p < 0.05, **p < 0.01. Error bars: ± SEM.
Table 1. Results from blood biochemistry tests in vehicle- or zaltoprofen-treated groups.
Data availability statement
The authors confirm that the data supporting the findings of this study are available within the article.