Figures & data
Table 1. Primer sequences used for quantitative reverse transcription-polymerase chain reaction (qRT-PCR).
Table 2. The antibodies used in this experiment.
Figure 1. shLBP decreased LBP mRNA and protein levels in MEFs with or without differentiation induction. (A) the mRNA and protein expression of LBP was detected by qRT-PCR and Western blot after transfection of shLBP. GAPDH was a loading control. (B) the mRNA and protein expression of LBP was detected by qRT-PCR and Western blot after transfection of shLBP and differentiation induction. GAPDH was a loading control. *** p < 0.001 vs. shNC group; ### p < 0.001 vs. shNC-D group. All experiments were repeated independently at least three times. Data was performed as the means ± standard deviation.
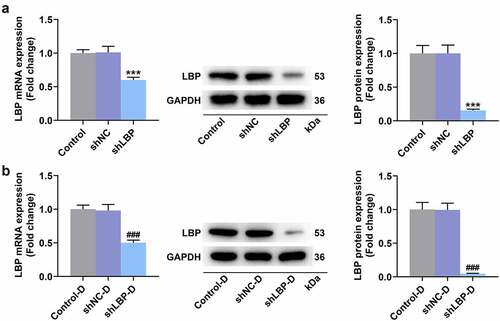
Figure 2. MEFs were successfully induced differentiation into adipocytes and shLBP upregulated UCP-1 level in differentiated MEFs. (A) the lipid in MEFs during differentiation induction was tested by oil red o staining assay with transfection of shLBP (scale: 100 µm; magnification: ×200). (B) the mRNA and protein expression of UCP-1 was detected by qRT-PCR Western blot after transfection of shLBP and differentiation induction. GAPDH was a loading control. # p < 0.05, ### p < 0.001 vs. shNC-D group. All experiments were repeated independently at least three times. Data was performed as the means ± standard deviation.
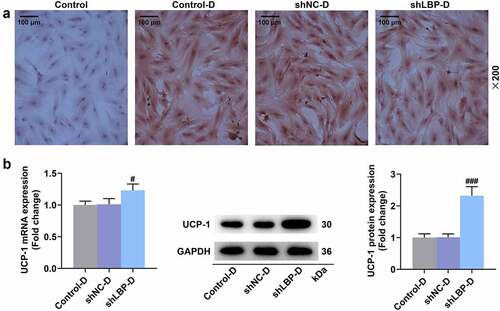
Figure 3. LBP knockdown promoted oxygen consumption and glucose uptake in differentiated MEFs. (A) Schematic representation of oxygen consumption measurement in MEFs transfected with shLBP with or without differentiation induction using a Seahorse XF96 analyzer. (B) the OCR of MEFs transfected with shLBP without differentiation induction in different time was assessed through Seahorse XF96 analyzer. (C) the OCR of MEFs transfected with shLBP with differentiation induction in different time was assessed through Seahorse XF96 analyzer. (D and E) the Glucose uptake of MEFs transfected with shLBP without (D) or with (E) differentiation induction was determined by [3H]-2DG uptake assay. # p < 0.05, ### p < 0.001 vs. shNC-D group. All experiments were repeated independently at least three times. Data was performed as the means ± standard deviation.
![Figure 3. LBP knockdown promoted oxygen consumption and glucose uptake in differentiated MEFs. (A) Schematic representation of oxygen consumption measurement in MEFs transfected with shLBP with or without differentiation induction using a Seahorse XF96 analyzer. (B) the OCR of MEFs transfected with shLBP without differentiation induction in different time was assessed through Seahorse XF96 analyzer. (C) the OCR of MEFs transfected with shLBP with differentiation induction in different time was assessed through Seahorse XF96 analyzer. (D and E) the Glucose uptake of MEFs transfected with shLBP without (D) or with (E) differentiation induction was determined by [3H]-2DG uptake assay. # p < 0.05, ### p < 0.001 vs. shNC-D group. All experiments were repeated independently at least three times. Data was performed as the means ± standard deviation.](/cms/asset/2737dac0-f14e-48f1-a802-88ff2ded0b29/kccy_a_2169521_f0003_oc.jpg)
Figure 4. LBP knockdown promoted browning and insulin sensitivity while inhibiting inflammation and autophagy in differentiated MEFs. (A) the representative image of Western blot evaluating the protein and mRNA expressions of LBP, IL-6, TNF-α, UCP-1, Dio-2, PGC-1α, aP2, LC3-I, LC3-II, Atg5, Insulin Receptor β and IRS-1 were detected by Western blot and qRT-PCR after transfection of shLBP and differentiation induction. GAPDH was a loading control. (B) the protein expression of PRDM16were detected by Western blot after transfection of shLBP and differentiation induction. ## p < 0.01, ### p < 0.001 vs. shNC-D group. All experiments were repeated independently at least three times. Data was performed as the means ± standard deviation.
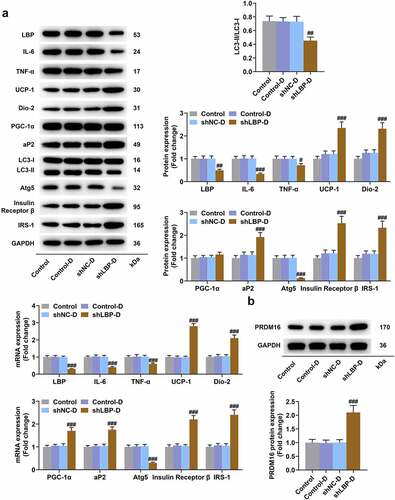
Figure 5. shLBP increased Atg5 level in differentiated MEFs. Atg5 level of MEFs was measured through immunofluorescence assay after transfection of shLBP and differentiation induction. All experiments were repeated independently at least three times. Data was performed as the means ± standard deviation.
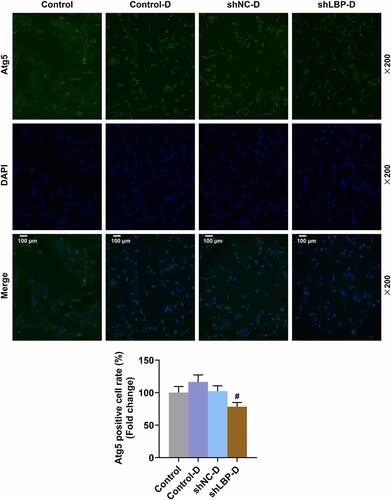
Figure 6. Co-transfection of Atg5 and shLBP decreased Atg5 and LBP and expression in MEFs with or without differentiation induction. (A and B) the mRNA and protein expressions of Atg5 and LBP were detected by qRT-PCR and Western blot after co-transfection of Atg5 and shLBP without (A) or with (B) differentiation induction. GAPDH was a loading control. *** p < 0.001 vs. NC +shnc group; ### p < 0.001 vs. NC +shnc-D group. All experiments were repeated independently at least three times. Data was performed as the means ± standard deviation.
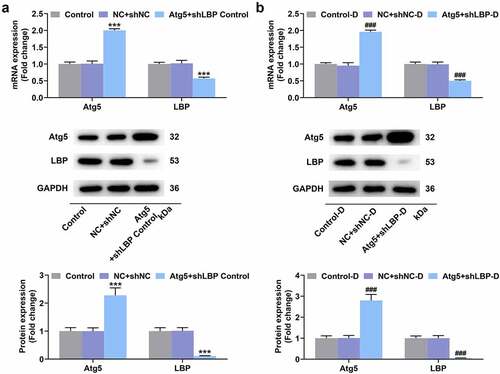
Figure 7. Atg5 overexpression reversed the effects of LBP knockdown on browning and oxygen consumption in differentiated MEFs. (A) the lipid in MEFs during differentiation induction was tested by oil red staining assay with transfection of Atg5 and shLBP (scale: 100 µm; magnification: ×200). (B) the mRNA and protein expressions of UCP-1 were detected by qRT-PCR and Western blot after transfection of Atg5 and shLBP with differentiation induction. GAPDH was a loading control. (E) Schematic representation of oxygen consumption measurement in MEFs transfected with Atg5 and shLBP with differentiation induction using a Seahorse XF96 analyzer. (F) OCR of MEFs transfected with Atg5 and shLBP with differentiation induction in different time was assessed through Seahorse XF96 analyzer. # p < 0.05 vs. NC +shnc-D group; ^ p < 0.05 vs. NC +shlbp-D group. All experiments were repeated independently at least three times. Data was performed as the means ± standard deviation.
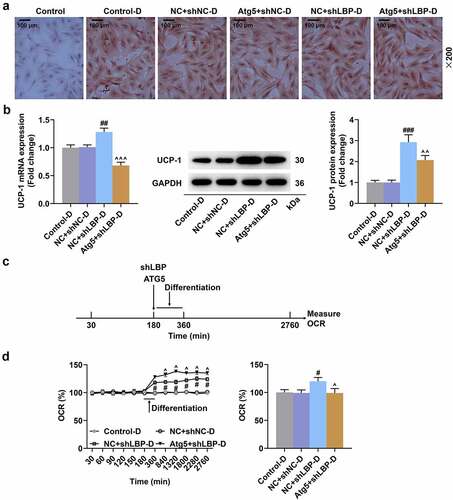
Figure 8. Atg5 overexpression reversed the effects of LBP knockdown on insulin sensitivity and autophagy in differentiated MEFs. (A) the representative image of Western blot evaluating the protein expressions of LBP, IL-6, TNF-α, UCP-1, Dio-2, PGC-1α, aP2, p62, LC3-I, LC3-II, Atg5, Insulin Receptor β and IRS-1 after transfection of Atg5 and shLBP with differentiation induction. GAPDH was a loading control. (B) the PRDM16 protein of was detected by Western blot after transfection of Atg5 and shLBP with differentiation induction. # p < 0.05, ## p < 0.01, ### p < 0.001 vs. NC +shnc-D group; ^^ p < 0.01, ^^^ p < 0.001 vs. NC +shlbp-D group. All experiments were repeated independently at least three times. Data was performed as the means ± standard deviation.
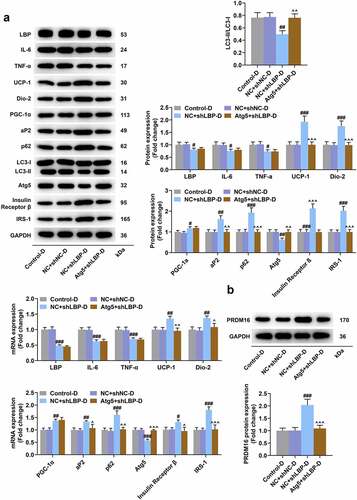
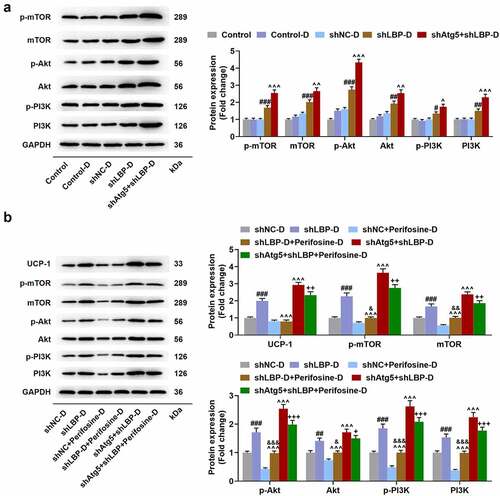
Figure 9. Atg5 knockdown enhanced the effect of LBP knockdown on activating PI3K/Akt/mTOR pathway while Perifosine partly reversed PI3K/Akt/mTOR pathway activation caused by LBP knockdown in differentiated MEFs. (A) the protein expressions of p-mTOR, mTOR, p-Akt, Akt, p-PI3K and PI3K were evaluated through Western blot after transfection of shAtg5 and shLBP with differentiation induction. GAPDH was a loading control. (B) the protein expressions of UCP-1, p-mTOR, and mTOR were evaluated through Western blot after transfection of shAtg5 and shLBP with differentiation induction as well as treatment of Perifosine. GAPDH was a loading control. # p < 0.05, ## p < 0.01, ### p < 0.001 vs. shNC-D group; ^ p < 0.05, ^^ p < 0.01, ^^^ p < 0.001 vs. shLBP-D group; & p < 0.05, && p < 0.01, &&& p < 0.001 vs. Perifosine-D group; + p < 0.05, ++ p < 0.01, +++ p < 0.001 vs. shAtg5+shlbp-D group. All experiments were repeated independently at least three times. Data was performed as the means ± standard deviation.