
Figures & data
Figure 1. Metformin impedes MM cell proliferation and promotes apoptosis.
Note: a-b: MM different cell lines H929 and MM.1S were intervened with metformin at various concentrations (0, 2.5, 5, 10, and 20 mM) for 48 h, and then cell viability was tested using CCK-8 assay. *P<0.05, **P<0.01 versus 0 mM metformin. c-d: Metformin at doses of 10 and 20 mm were selected, and CCK-8 assay was applied to further test the proliferation ability of H929, MM.1S cells at 0, 24, 48, and 72 h. e-g: Flow cytometry was applied to determine the apoptotic ability of H929, MM.1S cells after metformin intervention at doses of 10 and 20 mM for 48 h. Data were presented as mean ± SEM. N=3. *P < 0.05; ** P < 0.01.
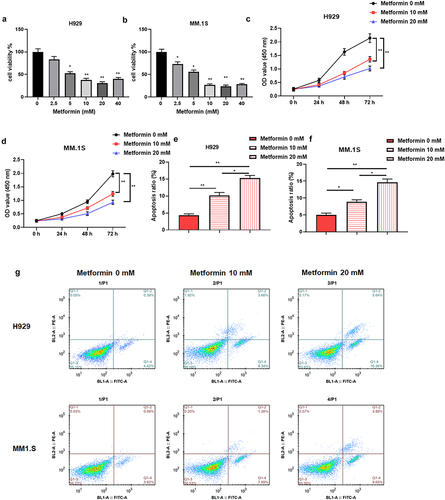
Figure 2. Metformin was able to reduce m6A abundance in MM.
Note: a: The m6A quantification analysis was employed to examine intracellular m6A levels in nPCs, H929 and MM.1S cells. b-c: The m6A quantification analysis was employed to detect intracellular m6A levels of H929, MM.1S cells after metformin intervention at doses of 10 and 20 mM for 48 h. d-e: RT-qPCR was used to examine the mRNA levels of METTL3, METTL14, WTAP, FTO, ALKBH5 under metformin treatment in H929, MM.1S cells. f-g: H929 cells were intervened with metformin at various concentrations (0, 2.5, 5, 10, and 20 mM) for 48 h, and then METTL3 protein level was measured using Western blotting. h-i: MM.1S cells were intervened with metformin at various concentrations (0, 2.5, 5, 10, and 20 mM) for 48 h, and then METTL3 protein level was applied using Western blotting. Data were presented as mean ± SEM. N=3. *P < 0.05; ** P < 0.01.
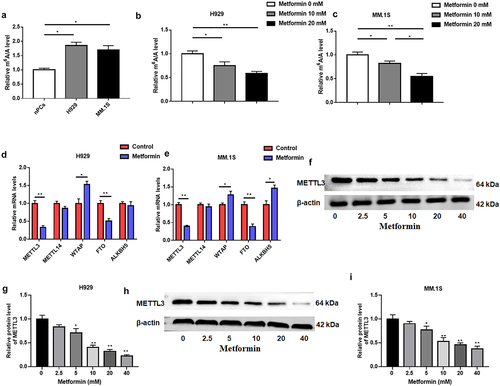
Figure 3. METTL3 overexpression counteracts metformin-mediated suppression of MM cell proliferation and facilitative effect of cell apoptosis.
Note: pcDNA-METTL3 and pcDNA-3.1 vectors were transfected alone into H929 and MM.1S for 24 h, followed by treating 20 mM metformin. a-b: Western blotting detection of the METTL3 protein levels in H929 or MM.1S cells transfected with pcDNA-METTL3 and with or without 20 mM metformin pre-treatment. c: CCK-8 assay was employed to test the proliferation ability of H929, MM.1S cells with or without 20 mM metformin intervention or/and pcDNA-METTL3 transfection. d: Flow cytometry was employed to determine the apoptotic ability of H929, MM.1S cells with or without 20 mM metformin intervention or/and pcDNA-METTL3 transfection. e: Western blotting detection of the METTL3 protein levels in H929 or MM.1S cells transfected with METTL3 shRNA or/and 20 mM metformin pre-treatment. f: CCK-8 assay detection of the proliferation ability of H929 or MM.1S cells transfected with METTL3 shRNA or/and 20 mM metformin pre-treatment. g: Flow cytometry detection of the apoptotic ability of H929 or MM.1S cells transfected with METTL3 shRNA or/and 20 mM metformin pre-treatment. Data were presented as mean ± SEM. N=3. *P < 0.05; ** P < 0.01.
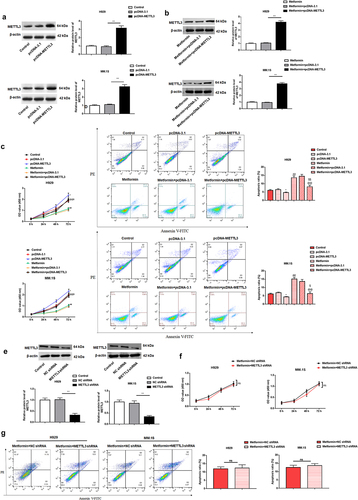
Figure 4. Mechanistic excavation into the involvement of metformin in MM progression through regulation of METTL3.
Note: A: UMAP visualization analysis of GSE29023 dataset samples. B-C: Volcano Plot of differentially expressed genes (DEGs) in GSE29023 dataset, which included 92 MM blood samples and 23 normal blood samples of MM samples. Abscissa axis indicates log2 (Fold Change). D: GO-BP entry enrichment bar plot. Abscissa is the proportion of genes identified and ordinate is the GO entry name. E: The resulting key genes were analyzed by Cytoscape software. F: Heatmap of the 22 differentially expressed upregulated genes. Group A was 8 normal blood samples and group B was 8 MM blood samples. G: After 20 mM metformin treatment of H929 cells for 48 h, mRNA levels of 22 genes including THRAP3, SDAD1, SNRPA1, RPL38, STUB1, PPIG, TOP1, RBM25, TAF3, RPL14, USP4, SNRNP200, EP300, MYO1C, YY1, UBXN2A, PNISR, SRP72, RAC1, PPP3CB, RBBP4, and TBL1XR1 were examined by using RT-qPCR. H: After 20 mM metformin treatment of H929 cells for 48 h, protein levels of 8 genes including THRAP3, SDAD1, SNRPA1, RPL38, STUB1, PPIG, TOP1, RBM25, TAF3, RPL14, USP4, SNRNP200, EP300, MYO1C, YY1, UBXN2A, PNISR, SRP72, RAC1, PPP3CB, RBBP4, and TBL1XR1 were examined by using Western blotting. Data were presented as mean ± SEM. N=3. *P < 0.05; ** P < 0.01.
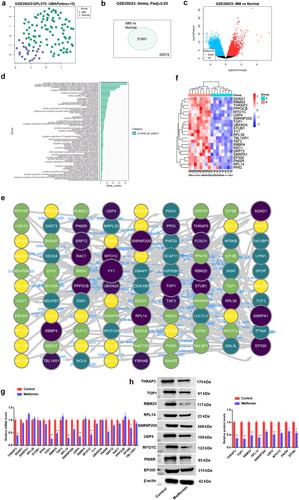
Figure 5. Metformin weakened METTL3-mediated m6A methylation of THRAP3, RBM25 and USP4.
Note: a: m6A binding sites on mRNA of THRAP3, RBM25, and USP4 and m6A peak profiles were predicted by online bioinformatics tools (http://www.cuilab.cn/sramp). b: The METTL3 binding motifs was retrieved at the Starbase website (https://starbase.sysu.edu.cn/), and possible binding sites of METTL3 on THRAP3, RBM25, and USP4 mRNA were analyzed. c: m6A quantitative analysis and MeRIP was used to analyze m6A global level and modification levels on THRAP3, RBM25, and USP4 in H929 cells after metformin treatment and/or METTL3 known-down. *P < 0.05 and **P < 0.01 vs NC shRNA. #P < 0.05 and ##P < 0.01 vs NC shRNA control. d: RT-qPCR was employed to test the mRNA levels of THRAP3, RBM25, and USP4 in H929 cells transfected with METTL3 shRNA and/or metformin treatment. **P < 0.01 vs NC shRNA. ##P < 0.01 vs NC shRNA control. e: RT-qPCR was employed to test the mRNA levels of THRAP3, RBM25, and USP4 in H929 cells intervened with Metformin and/or METTL3 shRNA. f: Actinomycin D (5 μg/ml) was added to the cells to assess mRNA stability of THRAP3, RBM25, and USP4. Data were presented as mean ± SEM. N=3. *P < 0.05; ** P < 0.01.
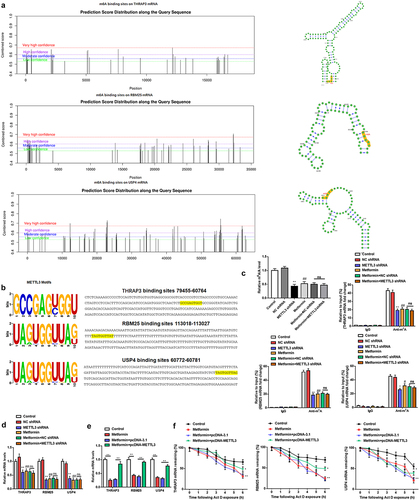
Figure 6. THRAP3, RBM25 or USP4 reversed the assistance of METTL3 on the malignant behavior of MM cells.
Note: a: The protein level of THRAP3 in H929 cells transfected with THRAP3 shRNA was employed by Western blotting. b: The protein level of RBM25 in H929 cells transfected with RBM25 shRNA was employed by Western blotting. c: The protein level of THRAP3, RBM25, and USP4 in H929 cells transfected with THRAP3 shRNA was employed by Western blotting. d: The mRNA expression of RBM25 and USP4 in H929 cells transfected with THRAP3 shRNA was employed by RT-qPCR. e: The mRNA level of THRAP3 and USP4 in H929 cells transfected with RBM25 shRNA was employed by RT-qPCR. f: The mRNA expression of THRAP3 and RBM25 in H929 cells transfected with USP4 shRNA was employed by RT-qPCR. g: CCK-8 assay was employed to determine the proliferation ability of H929 cells transfected with pcDNA-METTL3 or/and THRAP3 shRNA, RBM25 shRNA or USP4 shRNA. h-i: Flow cytometry was employed to determine the apoptotic ability of H929 cells transfected with pcDNA-METTL3 or/and THRAP3 shRNA, RBM25 shRNA or USP4 shRNA. j-l: RT-qPCR detection of the mRNA levels of THRAP3, RBM25, and USP4 in H929 cells after knockdown of THRAP3, RBM25, and USP4, respectively, under metformin pre-treatment. m: CCK-8 assay detection of the proliferation ability of H929 cells after knockdown of THRAP3, RBM25, and USP4, respectively, under metformin pre-treatment. n: Flow cytometry detection of the apoptotic ability of H929 cells after knockdown of THRAP3, RBM25, and USP4, respectively, under metformin pre-treatment. Data were presented as mean ± SEM. N=3. *P < 0.05; ** P < 0.01.
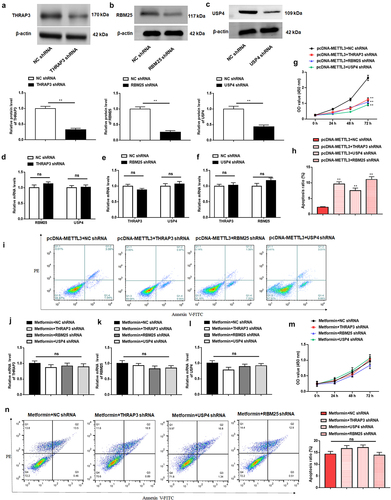
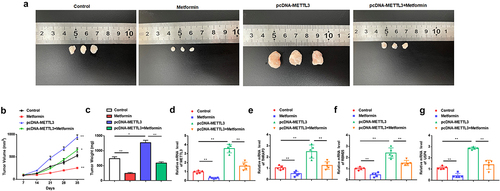
Figure 7. Metformin inhibits MM xenograft tumor growth by repressing METTL3 expression in nude mice.
Note: a: Representative photographs of tumors from each group. b: The tumor volumes in each group. c: The weights of tumors in each group. d: RT-qPCR detection of the mRNA levels of METTL3 in each group of tumors. e: RT-qPCR was used to determine the expression levels of THRAP3 in each group of tumors. f: RT-qPCR was employed to determine RBM25 levels in each group of tumors. g: RT-qPCR was employed to test USP4 levels in each group of tumors. Data were presented as mean ± SEM. N=3. *P < 0.05; ** P < 0.01.
Supplemental material