
Figures & data
Figure 1. Differential expression of family with sequence similarity of 83D (FAM83D) in many types of human tumors. (a) Differential expression of FAM83D in all tumors or specific tumor subtypes was analyzed via the TIMER 2.0 database. (b) FAM83D expression was different between normal tissues and primary tissues among candidate tumors in the ENCORI database. (c) FAM83D expression was different between normal tissues and primary tissues among candidate tumors in the DriverDbv3 database as well. *P < 0.05, ** P < 0.01, *** P < 0.001, and **** P < 0.0001.
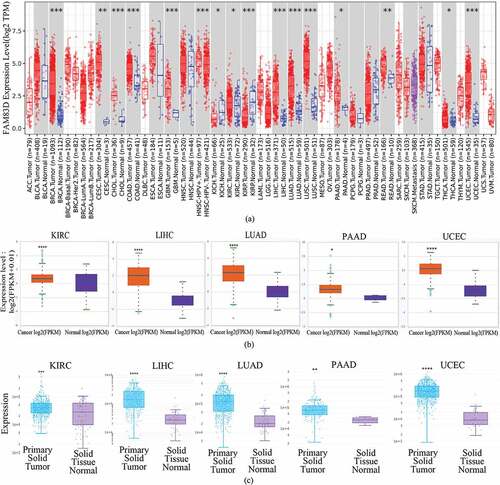
Figure 2. Family with sequence similarity of 83D (FAM83D) expression levels according to the clinical features of candidate tumors. (a) FAM83D expression levels across clinical stages of kidney renal clear cell carcinoma (KIRC), liver hepatocellular carcinoma (LIHC), lung adenocarcinoma (LUAD), and pancreatic adenocarcinoma (PAAD) were analyzed using the GEPIA 2 database. (b) FAM83D expression levels across tumor stages of KIRC, LIHC, LUAD, and uterine corpus endometrial carcinoma (UCEC) were analyzed using the TISIDB database. (c) FAM83D expression levels across molecular subtypes of LIHC and UCEC were analyzed using the TISIDB database. (d) FAM83D overexpression levels were associated with clinical features in LIHC using the UALCAN database. (e) FAM83D overexpression levels were associated with clinical features in LUAD using the UALCAN database. (f) FAM83D overexpression levels were associated with clinical features in UCEC using the UALCAN database.
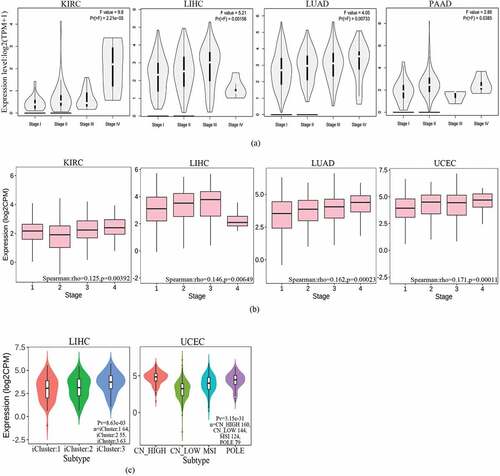
Figure 2. (continued).
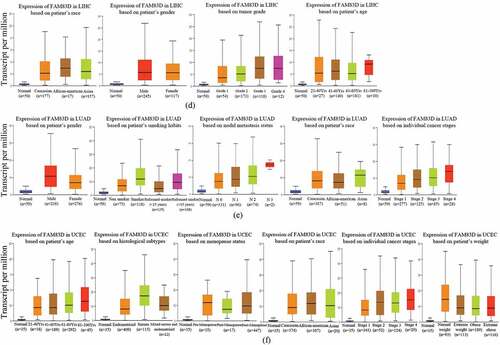
Figure 3. Correlation between family with sequence similarity of 83D (FAM83D) expression levels and survival curves in a range of cancers. (a) Survival map of all cancers with regard to overall survival (OS) and disease-free survival (DFS) were analyzed through the GEPIA 2 database. (b) Correlation between FAM83D expression levels and survival value in the GEPIA 2 database. (c) the OS of liver hepatocellular carcinoma (LIHC), lung adenocarcinoma (LUAD), pancreatic adenocarcinoma (PAAD), and uterine corpus endometrial carcinoma (UCEC) in the UALCAN database. (d) the OS of kidney renal clear cell carcinoma (KIRC), LIHC, LUAD, PAAD, and UCEC in the TISIDB database.
Figure 4. Correlation between family with sequence similarity of 83D (FAM83D) expression levels and driver gene and promoter DNA methylation in a range of cancers. (a) Correlation between FAM83D expression and mutated driver genes in pan-cancer within the TIMER 2.0 database. (b) Correlation between FAM83D expression and mutated TP53 in liver hepatocellular carcinoma (LIHC), lung adenocarcinoma (LUAD), and uterine corpus endometrial carcinoma (UCEC) by the UALCAN database. (c) the correlation between FAM83D expression and mutated TP53 in LIHC, LUAD, pancreatic adenocarcinoma (PAAD), and UCEC in the TIMER 2.0 database. (d) Using the UALCAN database, highly-expressed FAM83D was analyzed with regard to promoter DNA methylation in kidney renal clear cell carcinoma (KIRC), LIHC, and UCEC. **** P < 0.0001.
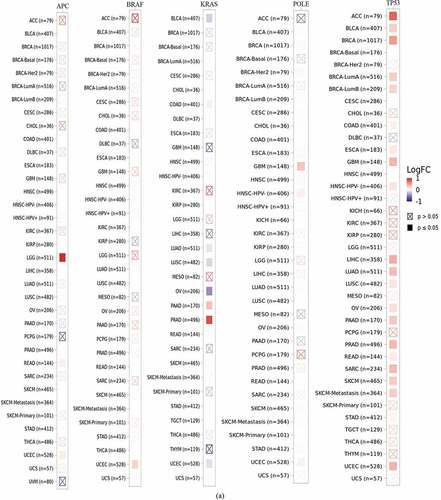
Figure 4. (continued).
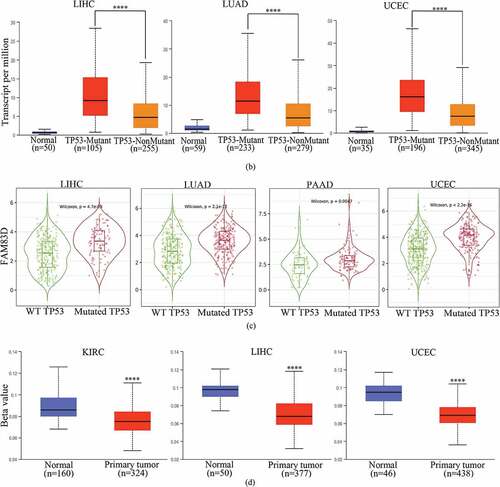
Figure 5. Family with sequence similarity of 83D (FAM83D)-related gene enrichment analysis. (a) and (b) FAM83D-binding proteins and genes related to FAM83D were individually analyzed via the STRING database (a) and the Gene MANIA online tool (b). (c) Correlation between the primary FAM83D-related genes (CSNK1A1 and HMMR) and FAM83D expression in pan-cancer, obtained via the TIMER 2.0. (d) and (e) FAM83D expression was associated with CSNK1A1 (d) and HMMR (e) in candidate tumors within the GEPIA 2 database.
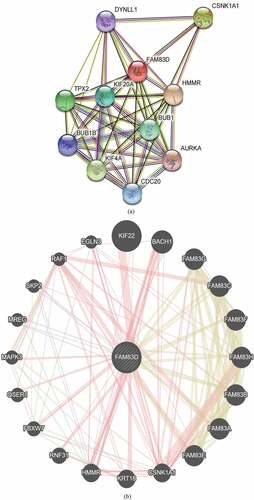
Figure 5. (continued).
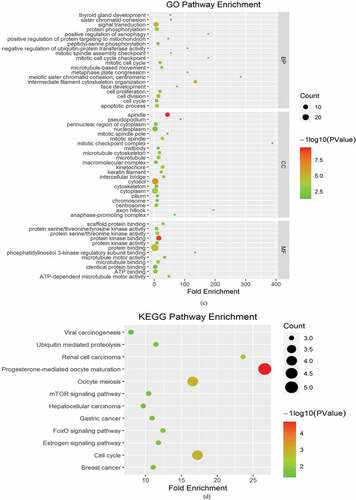
Figure 6. Heatmaps for Gene Ontology (GO) and Kyoto Encyclopedia of Genes and Genomes (KEGG) pathway analyses across family with sequence similarity of 83D (FAM83D) interactive genes. (a) and (b) GO enrichment (a) and KEGG pathway analysis (b) for FAM83D were performed using the Metascape online tool. (c) and (d) GO enrichment (c) and KEGG pathway analyses (d) for FAM83D were performed via the DAVID database.
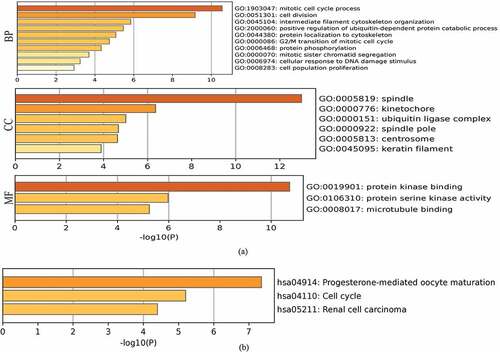
Figure 6. (continued).
Data availability statement
All databases are freely available as public resources.