
Figures & data
Table 1. siRNA sequences of Mtf-1 and Plgf.
Figure 1. Representative zinc probe fluorescence images in PASMCs. a Elevated intensity of fluorescent indicator which reflects intracellular free zinc levels in MCT-PASMCs compared with control (n = 3). b Elevated intensity of fluorescent indicator which reflects intracellular free zinc levels in PASMCs in response to increased ZnSO4 concentration in medium (n = 3). Ctrl: control; MCT: PASMCs isolated from MCT-PAH rats. Scale bar = 25 μm.
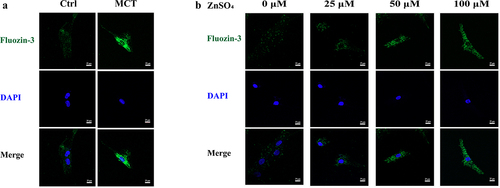
Figure 2. Enhanced MTF-1 expression in lung tissues of MCT-PAH rats. a,b Construction of MCT-PAH model in rats. MCT-induced PAH was characterized by elevated mPAP and RVHI (n = 8). Scale bar = 50 μm. c-e Pulmonary arterioles wall thickened and increment of WT% and WA% in MCT-PAH rats (n = 8). Scale bar = 50 μm. f,g The elevated expressions of MTF-1 and PlGF in lung tissues of MCT-PAH rats (n = 5). h More positive cells were found in MCT-PAH pulmonary arteries, including MTF-1, PlGF and PCNA (n = 8). Scale bar = 100 μm. i Higher expression of MTF-1 in MCT-PAH pulmonary arteries. α-SAM [red], MTF-1 [green] and DAPI [blue] (n = 5). Scale bar = 50 μm. Ctrl: control; MCT-PAH: MCT induced PAH. *P<0.05 vs. Ctrl. The arrow points to the pulmonary artery.
![Figure 2. Enhanced MTF-1 expression in lung tissues of MCT-PAH rats. a,b Construction of MCT-PAH model in rats. MCT-induced PAH was characterized by elevated mPAP and RVHI (n = 8). Scale bar = 50 μm. c-e Pulmonary arterioles wall thickened and increment of WT% and WA% in MCT-PAH rats (n = 8). Scale bar = 50 μm. f,g The elevated expressions of MTF-1 and PlGF in lung tissues of MCT-PAH rats (n = 5). h More positive cells were found in MCT-PAH pulmonary arteries, including MTF-1, PlGF and PCNA (n = 8). Scale bar = 100 μm. i Higher expression of MTF-1 in MCT-PAH pulmonary arteries. α-SAM [red], MTF-1 [green] and DAPI [blue] (n = 5). Scale bar = 50 μm. Ctrl: control; MCT-PAH: MCT induced PAH. *P<0.05 vs. Ctrl. The arrow points to the pulmonary artery.](/cms/asset/4f3e3134-1abf-46c3-b543-917afc1e47f5/kccy_a_2205209_f0002_oc.jpg)
Figure 3. Enhanced MTF-1 expression in MCT-PASMCs. a The bright field and immunofuorescence staining of PASMCs. Scale bar = 100 μm and 25 μm. b,c The elevated expression of MTF-1 and PlGF in MCT-PASMCs (n = 5). Ctrl: control; MCT: PASMCs isolated from MCT-PAH rats. *P<0.05 vs. Ctrl.
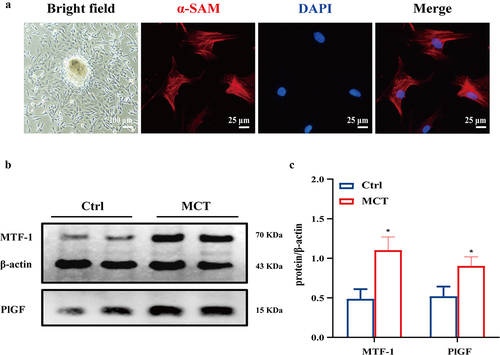
Figure 4. The effect of moderate ZnSO4 on PASMCs proliferation. a,b CCK8 and EdU assay showed PASMCs proliferated in a time-dose manner in ZnSO4 group and treatment with 24 h of 100 μM ZnSO4 was the most optimal (n = 8, 5). Scale bar = 100 μm. c,d The elevated expression of MTF-1 and PlGF in ZnSO4-treated PASMCs (n = 5). Ctrl: control; ZnSO4: ZnSO4-treated PASMCs. *P<0.05 vs. 0 μM at the same time.
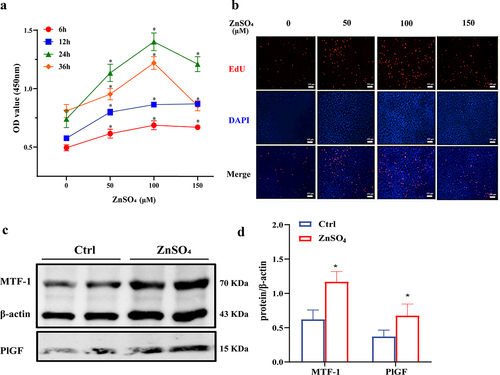
Figure 5. Nuclear localization of MTF-1 in MCT-PASMCs and ZnSO4-treated PASMCs. a Immunofluorescence staining showed MTF-1 localized to nucleus in MCT-PASMCs and ZnSO4-treated PASMCs (n = 3). Scale bar = 25 μm. b-e Reduced cytoplasmic MTF-1 and increased nuclear MTF-1 in MCT-PASMCs and ZnSO4-treated PASMCs (n = 5). Ctrl: control; MCT: PASMCs isolated from MCT-PAH rats; ZnSO4: ZnSO4-treated PASMCs. *P<0.05 vs. Ctrl.
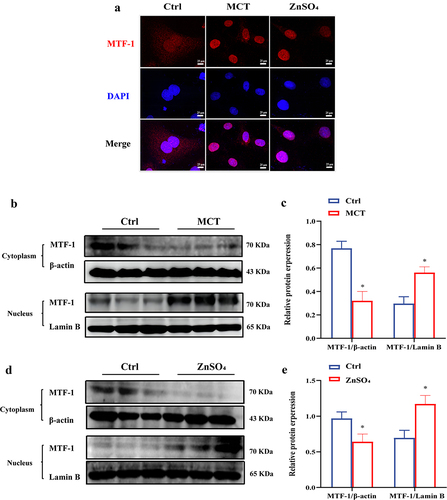
Figure 6. Role of ZnSO4 in regulation of MTF-1-mediated transcription of PlGF. a Base-pair binding between MTF-1 and MREs within Plgf 3′-untranslated regions (UTRs). b Luciferase assays of Plgf 3′-UTR constructs with intact and mutated sequences for MTF-1 in HEK293T cells. Elevated transcriptional activity of MTF-1 on intact Plgf promoters in response to ZnSO4, but not significantly on the mutated promoter (n = 8). HEK293T: HEK293T without transfection of any plasmid; HEK293T+WT: HEK293T with transfection of wild-type promoter; HEK293T+MUT: HEK293T with transfection of mutative promoter; Ctrl: control; ZnSO4: 100 μM ZnSO4 treatment for 24 h. *P<0.05 vs. wild-type promoter without treatment, #P<0.05 vs. wild-type promoter with treatment of ZnSO4, nsP>0.05.
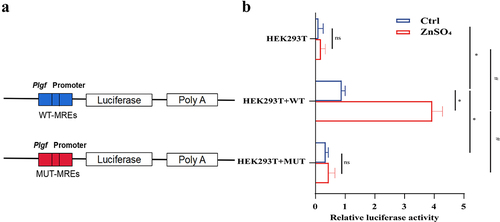
Figure 7. The negative effect of Mtf-1/Plgf-siRNA on MCT-PASMCs proliferation. a,b Loss of Mtf-1 downregulated the expressions of MTF-1, PlGF and PCNA in MCT-PASMCs (n = 5). c,d EdU and CCK8 assay revealed knocking down Mtf-1 reduced MCT-PASMCs proliferation (n = 5, 8). e Scratch assay showed that Mtf-1-siRNA abated MCT-PASMCs migration (n = 5). f,g Loss of Plgf downregulated the expressions of PlGF and PCNA in MCT-PASMCs (n = 5). h,i EdU and CCK8 assay revealed knocking down Plgf reduced MCT-PASMCs proliferation (n = 5, 8). j Scratch assay showed that Plgf-siRNA abated MCT-PASMCs migration (n = 5). Ctrl: control; MCT: PASMCs isolated from MCT-PAH rats; NC: negative control. *P<0.05 vs. Ctrl, #P<0.05 vs. MCT, $P<0.05 vs. MCT+NC. EdU assay scale bar = 100 μm, scratch assay scale bar = 100 μm.
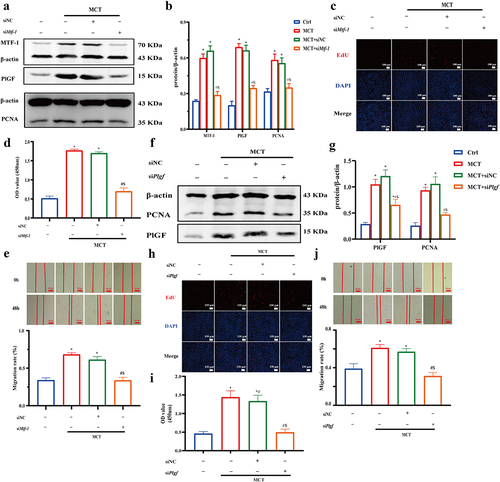
Figure 8. The negative effect of Mtf-1/Plgf-siRNA on ZnSO4-treated PASMCs proliferation. a,b Loss of Mtf-1 downregulated the expressions of MTF-1, PlGF and PCNA in ZnSO4-treated PASMCs (n = 5). c,d EdU and CCK8 assay revealed knocking down Mtf-1 reduced ZnSO4-treated PASMCs proliferation (n = 5, 8). e Scratch assay showed that Mtf-1-siRNA abated ZnSO4-treated PASMCs migration (n = 5). f,g Loss of Plgf downregulated the expressions of PlGF and PCNA in ZnSO4-treated PASMCs (n = 5). h,i EdU and CCK8 assay revealed knocking down Plgf reduced ZnSO4-treated PASMCs proliferation. (n = 5, 8). j Scratch assay showed that Plgf-siRNA abated ZnSO4-treated PASMCs migration (n = 5). Ctrl: control; ZnSO4: ZnSO4-treated PASMCs; NC: negative control. *P<0.05 vs. Ctrl, #P<0.05 vs. NC, $P<0.05 vs. ZnSO4, &P<0.05 vs. siMtf-1/Plgf. EdU assay scale bar = 100 μm, scratch assay scale bar = 100 μm.
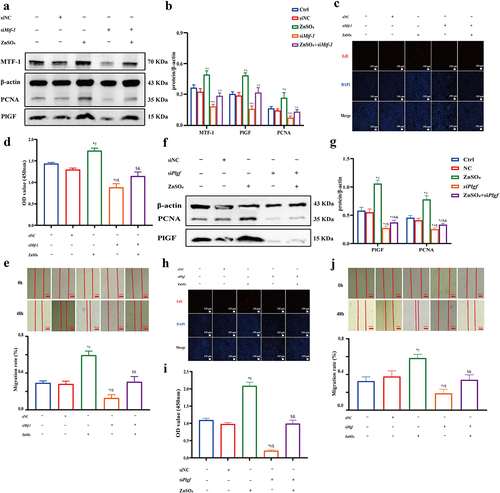
Figure 9. Gö 6983 inhibited PKC signaling pathway activation to reduce PlGF expression mediated by MTF-1. a,b The negative effect of Gö 6983 on p-PKCζ, t-PKC, MTF-1 and PlGF levels in MCT-PASMCs (n = 5). c,d EdU and flow cytometry showed Gö 6983 decreased MCT-PASMCs proliferation (n = 5). e,f The negative effect of Gö 6983 on p-PKCζ, t-PKC, MTF-1 and PlGF levels in ZnSO4-treated PASMCs (n = 5). g,h EdU and flow cytometry showed Gö 6983 decreased ZnSO4-treated PASMCs proliferation (n = 5). Ctrl: control; MCT: PASMCs isolated from MCT-PAH rats; ZnSO4: ZnSO4-treated PASMCs. *P<0.05 vs. Ctrl, #P<0.05 vs. MCT/ZnSO4. EdU assay scale bar = 100 μm.
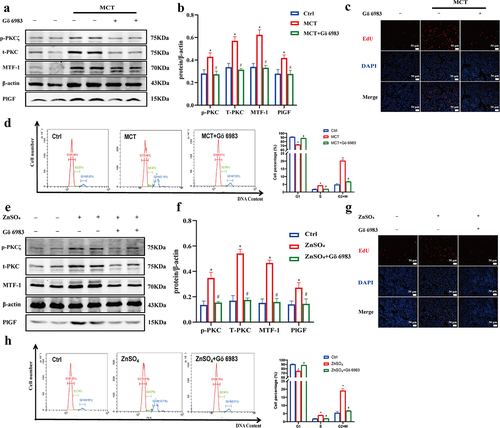
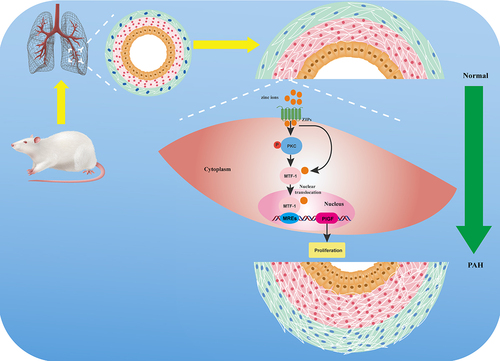
Figure 10. A schematic diagram of molecular mechanism underlying MTF-1 mediated proliferation of PASMCs. Extracelluar elevated zinc ions enter the cytoplasm through ZIPs, resulting in the binding of zinc ions to zinc fingers in MTF-1 and phosphorylation of PKC. Binding of zinc ions leads to NSL exposure, which leads to nuclear translocation of MTF-1 and MTF-1 transcriptionally promotes PlGF expression through the activation of PKC, thus, promotes PASMCs proliferation. MTF-1: metal-regulatory transcription factor 1; PASMCs: pulmonary arterial smooth muscle cells; ZIPs: Zrt-like, IRT-like proteins; PKC: protein kinase C; MREs: metal-response elements; PlGF: placental growth factor.
Data availability statement
Due to the nature of this research, participants of this study did not agree for their data to be shared publicly, so supporting data is not available.