Figures & data
Table 1. List of primers used for Qrt-PCR.
Figure 1. Ratio of heart weight (mg)/weight (g) of mice and cardiac functional and structural changes. Control mice are the sham group. TAC mice received TAC and were observed for 1 week; Sw+TAC: preconditioned mice on which TAC was performed at the end of 21 days of swimming training. We observed a significantly higher heart weight to body weight ratio in TAC mice as compared to control and preconditioned TAC mice (A) (***P < 0.001 vs. control, ##P < 0.01 vs. TAC). Two-dimensional echocardiography was performed to analyze cardiac structure (B), and we monitored time-course changes in several echo-derived parameters including LV mass, LVIDd, LVESD, and EF in control, TCA, and TCA+SW mice. We normalized the mass of LV+ S, LA, RV, and RA to the corresponding tibial length (TL), and also assessed wet and dry lung weights. Statistical analysis was performed with *P < 0.05, **P < 0.01, and ***P < 0.001 vs. control, and #P < 0.05 and ##P < 0.01 vs. TAC. All data were presented as mean ± SD from three independent experiments.
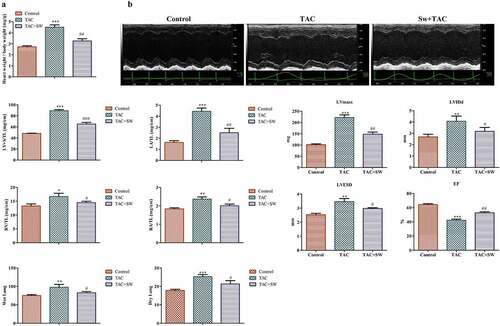
Figure 2. Exercise-induced myocardial hypertrophy preconditioning inhibits myocardial fibrosis by promoting premature senescence of fibroblasts in vivo.
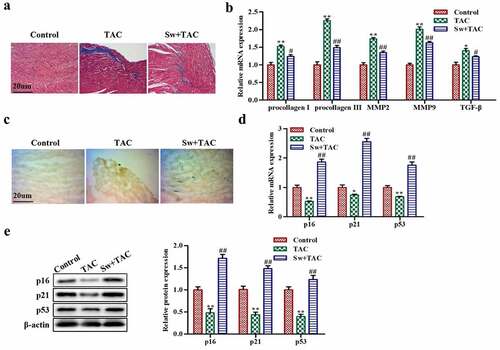
Figure 3. The effect of myocardial hypertrophy preconditioning on premature senescence of cardiac fibroblasts in vitro. (a,b): The levels of procollagen I, procollagen III, MMP2, MMP9, and TGF-β proteins in cardiac fibroblasts were evaluated using western blot analysis. (c): the protein expression levels of p16, p21, and p53 in cardiac fibroblasts were analyzed using western blotting. (d): the TUNEL assay was performed on cardiac fibroblasts, and TUNEL-positive cells were stained green. (e): to detect proliferation, EdU staining was performed on cardiac fibroblasts. **P < 0.01, *P < 0.05 vs. Control, ##P <0.01, #P <0.05 vs. NE. Data were presented as mean±SD from three independent experiments.
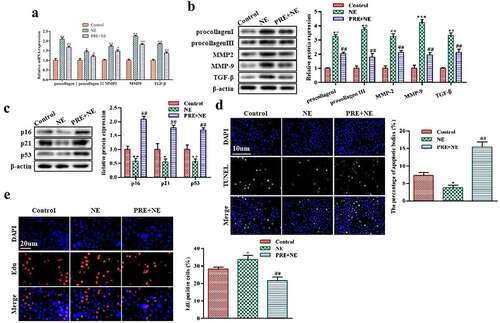
Figure 4. The effect of exercise-induced myocardial hypertrophy preconditioning on Nrf2 signaling pathway. (a,b) shows Qrt-PCR and western blot analysis for detecting Nrf2 mRNA and protein levels in cardiac fibroblasts, respectively. GAPDH was used as the housekeeping gene for the RT-qPCR experiments. (c, d) shows the Qrt-PCR and western blot analysis for detecting Nrf2 mRNA and protein levels, respectively, in cardiac tissues of an animal model. (e) indicates the Qrt-PCR analysis of HO-1, NQO-1, and GCLC mRNA levels in cardiac fibroblasts with GAPDH used as the control. (f) shows western blot analysis of HO-1, NQO-1, and GCLC protein levels in cardiac fibroblasts. ***P < 0.01, ##P < 0.05 vs. control, *P < 0.01 vs. NE. Data were presented as mean±SD from three independent experiments.
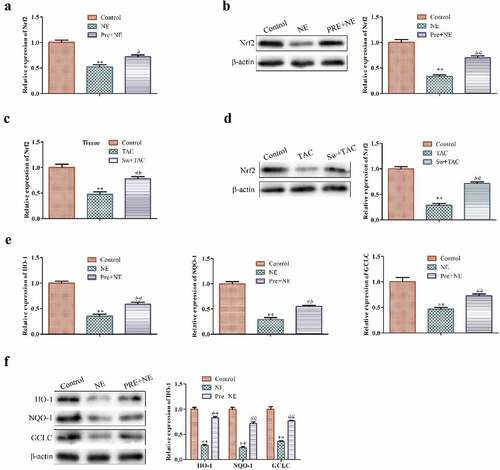
Figure 5. Effects of S100A8/9 on Nrf2 protein in fibroblasts. (a) Qrt-PCR analysis was performed to determine the expression of S100A8/9 using GAPDH as the housekeeping gene in the control, NE, and Pre + NE groups. (b and c) Western blot analysis of Nrf2 protein in basal fibroblasts, S100A8/9 overexpressing fibroblasts, and S100A8/9 silenced fibroblasts. The data indicate a significant increase in Nrf2 protein expression in S100A8/9 silenced fibroblasts compared to the control (***P < 0.001, ##P < 0.01 vs. control, *P < 0.01 vs. NE). All data presented are the mean±SD from three independent experiments.
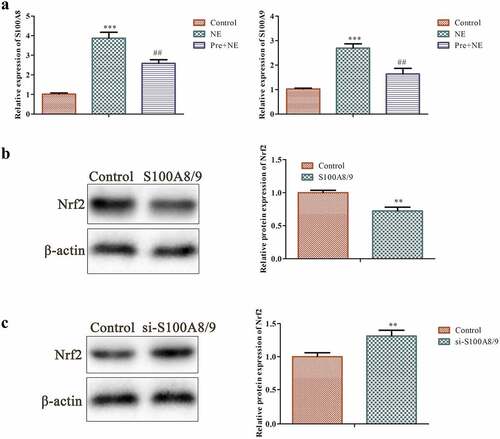
Figure 6. The effect of Nrf2 knockdown on the myocardial fibrosis. (a) Representative pictures of TUNEL assay of cardiac fibroblasts. TUNEL-positive cells were stained green. (b) Representative images of EdU-positive cardiac fibroblasts. (c) Western blots of p16, p21 and p53 proteins in cardiac fibroblasts. (d) Qrt-PCR analysis was conducted to detect procollagen I, procollagen III, MMP2, MMP9, and TGF-β mRNA levels in cardiac fibroblasts using GAPDH as the housekeeping gene. (e) Western blotting of procollagen I, procollagen III, MMP2, MMP9 and TGF-β proteins in cardiac fibroblasts. **P < 0.01, *P < 0.05 vs. control, ##P <0.01, #P <0.05 vs. NE. Data were presented as mean±SD from three independent experiments.
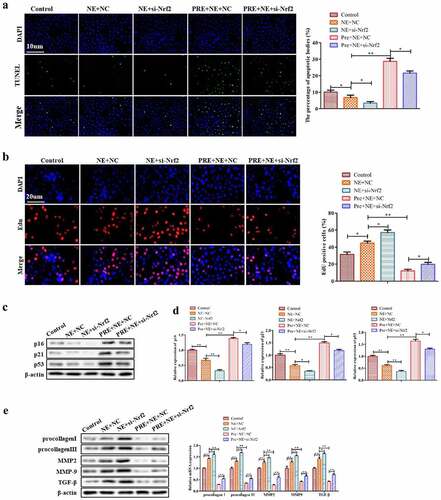
Figure 7. The impact of preconditioning and silencing of Nrf2 on the response of fibroblasts to oxidative stress induced by NE stimulation. The panel (a) shows representative fluorescence images of fibroblasts stained with DCFDA (2´,7´-dichlorofluorescein diacetate) for detecting ROS levels in four groups: control, NE, Pre + NE, and Pre + NE + Si-Nrf2. B the levels of SOD and GPx activities in these groups were measured using Superoxide Dismutase Activity Assay Kit and Glutathione Peroxidase Assay Kit, respectively. The control group served as a baseline for comparison, and statistical significance was represented as ***P < 0.001 vs control, ##P < 0.01 vs NE, P < 0.001, $$P < 0.01 vs Pre + NE.
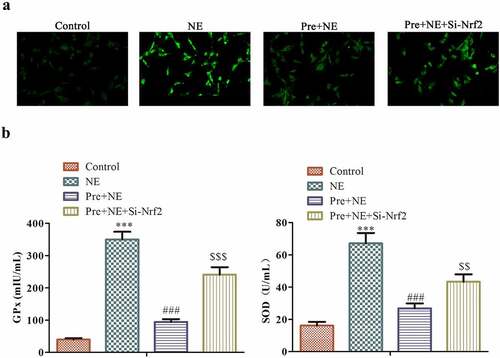
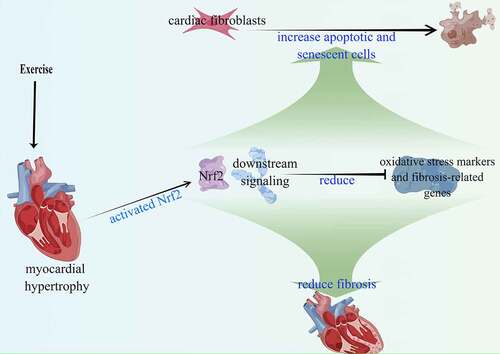
Figure 8. Exercise-induced myocardial hypertrophy preconditioning activates the Nrf2 signaling pathway. The activation results in increased expression of downstream target genes (HO-1, NQO-1, and GCLC), leading to reduced expression of oxidative stress and fibrosis-related genes.