Figures & data
Figure 1. Assessing the reliability of individual DDE. (a) scatter plot with marginal density curves showing the number of differential expression and DDE. (b) scatter pie plot illustrating fractions of mutations, CNA, and differential methylation for genes. (c) ternary plot analyzing the percentage of the mutation, CNA and differential methylation of genes. (d) odds ratio of DDE in census cancer genes, TF, and top genes in PPI network. (e) intersection between non-DDE and targets of transcription factors with DDE for each sample. The regulatory model is showed in central circle. The size of intersection and P-values are showed by bar plots in the inner and outer ring, respectively. (f) line charts displaying the ratios of deletions to gains and hypomethylation to hypermethylation in upregulation, downregulation, and non-differential expression. (g-l) distribution of interaction sizes between differential expression and genomic or epigenomic alterations based on permutation analysis. Black arrows indicate the actual intersection sizes. (m) ratio of mutation types within upregulation and downregulation. P-values were calculated by the Wilcoxon rank-sum test. (n) percentage of mutation types in non-differentially expressed and downregulated TP53.
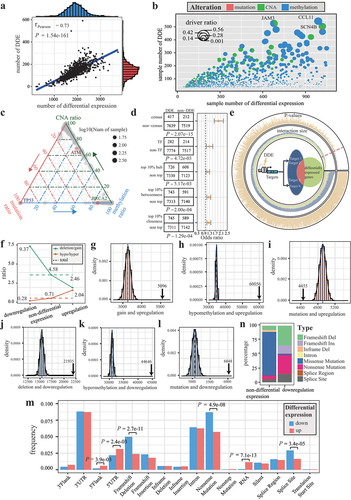
Figure 2. Distinct molecular and clinical features among breast cancer subtypes. (a) violin plot showing the distribution of DDE fraction across breast cancer subtypes. (b) the relationships among over-represented genes are displayed in a venn plot. Percentages in each tile represent the proportion of subtype-specific genes. (c) GO functional enrichment analysis for subtype-specific genes. (d) Kaplan–Meier survival curves for subtypes. (e) the Chord plot displays the number of samples shared between our subtypes (upper semicircle) and PAM50 classification (lower semicircle). The size of the arc is proportional to the number of samples. (f) summary of clinical features (top) and subtype-specific genes (bottom) corresponding to each subtype.
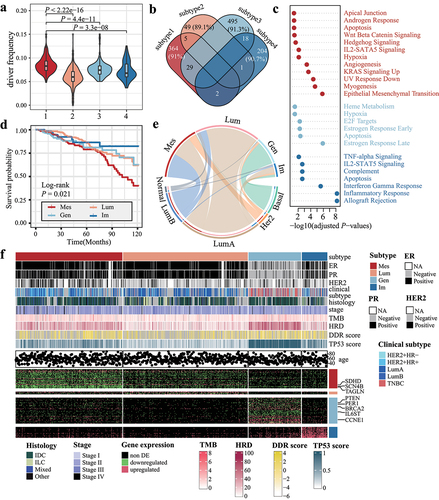
Figure 3. Top subtype-specific genes reveal prognosis-related DDE. (a) the MCA plot illustrates a global distance between subtype-specific genes and samples. The top 10 Mes subtype-specific genes are labeled and represented by black points. (b) scatter pie plot illustrates the distribution of the top 10 subtype-specific genes for each subtype; the coordinates of the pies indicate the frequencies of differential expression and DDE. (c) OncoPrint diagram displays the DDE patterns for four Mes subtype-specific genes located in the chromosome 11q23 region. (d) Half-violin plots showing the expression levels of Mes subtype-specific genes in the 11q23 region. (e) Kaplan–Meier survival curves and risk tables for patients in the METABRIC dataset, categorized based on the presence or absence of deletions in the 11q23 region.
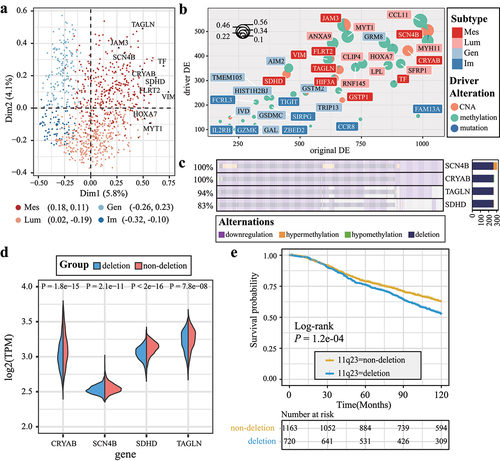
Figure 4. SDHD promotes invasion and migration of MCF-7 cells. (a) qRT-PCR showed knockdown effect of the si-SDHD and expression of EMT related markers. n = 6. (b) the effect of si-SDHD on EMT related protein level was evaluated by western blot analysis. n = 3. (c) immunofluorescence staining of ZO-1 and N-cadherin suggested the mesenchymal transition after silencing of SDHD. bar = 20 μm; n = 5. (d) EdU fluorescent staining indicated that si-SDHD promoted the proliferation of MCF-7 cell. bar = 50 μm; n = 5. (e-f) wound healing (bar = 200 μm; n = 6) and transwall assays (bar = 100 μm; n = 5) showed that si-SDHD facilitated cell migration and invasion. (g-h) overexpression of SDHD and relative expression of ZO-1 and CDH2 were confirmed by qRT-PCR (n = 6) and western blot (n = 3). (i) ZO-1 and N-cadherin expression in MCF-7 were assessed by immunofluorescence. bar = 20 μm; n = 5. (j) the proliferation ability of MCF-7 was analyzed by EdU experiment. bar = 50 μm; n = 5. (k-l) wound healing assays (bar = 200 μm; n = 6) and transwall (bar = 100 μm; n = 5) were performed to investigate the cell migration after transfected by SDHD. *P < 0.05; **P < 0.01.
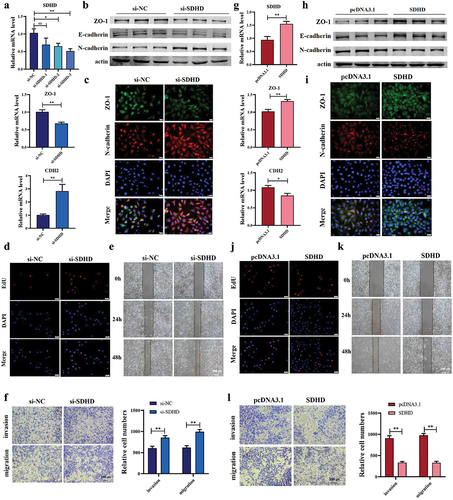
Figure 5. Breast cancer subtypes are enriched in different tumor-infiltrating immune cells. (a-b) the violin plots show the estimation of tumor purity using the (a) ESTIMATE and (b) ABSOLUTE method. The x-axes represent the four breast cancer subtypes, and the y-axes represent tumor purities. (c) immune scores and (d) stromal scores are estimated using the ESTIMATE method for breast cancer subtypes. (e) the heatmap displays the aggregated relative fraction of immune cell types. (f) the scatter plot shows the ratio of CD8+ T cell to macrophage for breast cancer subtypes. Correlation coefficients for each subtype are displayed in the upper-left and right-lower corner. (g) the scatter plot illustrates the ratio of M1 to M2 macrophage fraction for breast cancer subtypes. (h) the performance of the random forest model is displayed using a confusion matrix. The overall percentages are in the middle of each tile. (i) predicted subtype labels, clinical subtype, ER, and HER2 status of bulk samples from GSE180286. (j) the proportions of M1 and M2 macrophage. Gen samples are indicated with asterisks at the bottom.
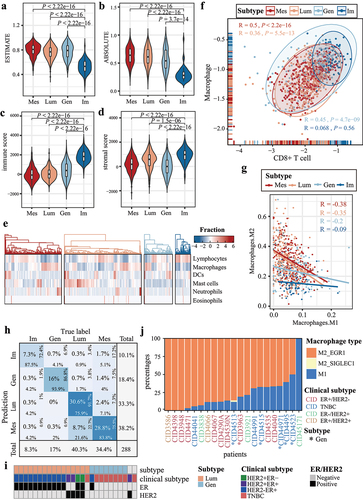
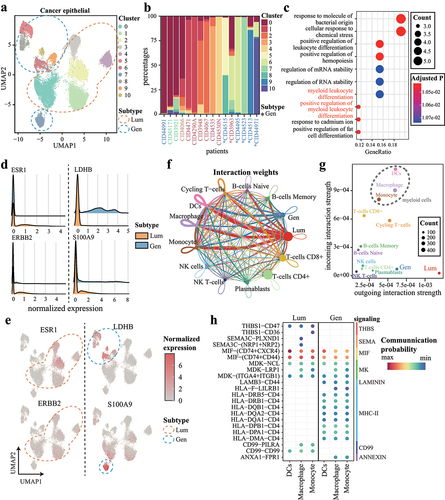
Figure 6. Cancer cell subsets in Lum subtype and Gen subtype regulate macrophage polarization. (a) UMAP representation of cancer epithelial cells. Blue and orange circles indicate Lum and Gen subtype, respectively. (b) the proportions of cancer cell clusters. Columns represent samples and are colored by clinical subtypes. Gen samples are indicated with asterisks at the bottom. (c) the top 10 most significant GO biological processes for highly expressed genes in Lum cancer cells. (d-e) expression of ESR1, ERBB2, and highly expressed genes in (d) subtypes and (e) clusters. (f) cell-to-cell communications occurring within and across cell types. Edge widths indicate cell–cell interaction strengths and are colored according to cell types. (g) scatter plot showing interaction strengths among cells. (h) significant interactions originating from cancer cells targeting to macrophages.