
Figures & data
Figure 1. BJ deficient for telomerase fail to be reprogrammed into iPSCs.
a. Generation of TERT knock-out BJ fibroblasts by targeting the exon2 of TERT using the CRISPR/Cas9 technology. The sequences of BJ clones with successful TERT knockout are indicated. b. Generation of TERC knock-out BJ fibroblasts. Two sgRNAs flanking TERC were designed to delete TERC. Sequence of BJ clone with successful TERC deletion is indicated. Image of DNA electrophoresis gel showing the successful deletion of TERC is shown. c. Reprogramming of BJ fibroblasts with (WT) or without telomerase genes (TERT−/−&TERC−/−). Representative images of alkaline phosphatase (AP) staining showing iPS colonies are shown. Bright field images showing iPS colonies (yellow arrow) on feeders (top) and iPSCs established on feeder-free culture (bottom). d. Representative images of western blot analyzing NANOG, OCT4, TERT and TRF1 in different iPS clones at indicated passages by western blot. e. Protein level quantification. Bars represent mean values and error bars the standard deviation. One-way ANOVA was used for statistical analysis. n=number of independent clones.
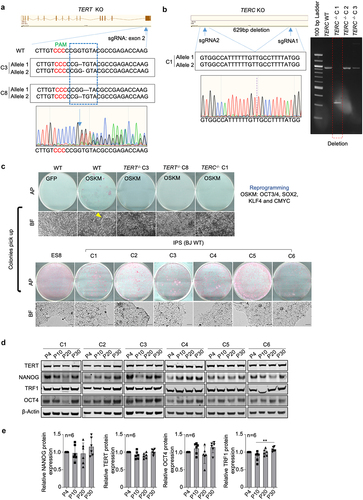
Figure 2. Progressive telomere elongation in reprogrammed hiPSCs.
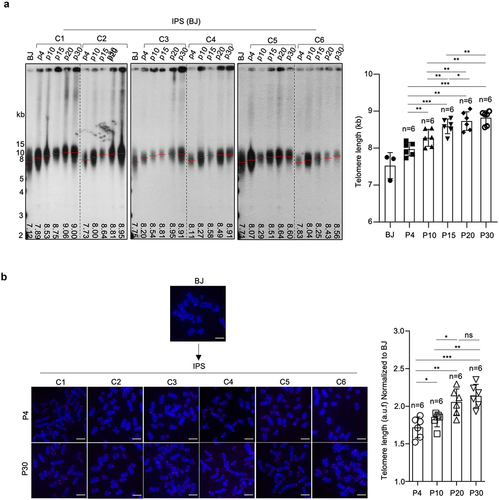
Figure 3. Telomerase is reactivated and maintained in hiPSCs.
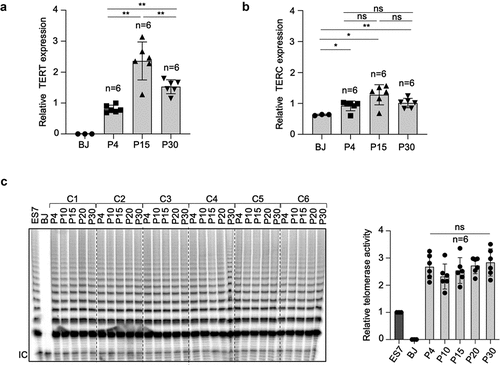
Figure 4. Telomeres of hiPSCs and hESCs are protected and genomically stable throughout successive passages.
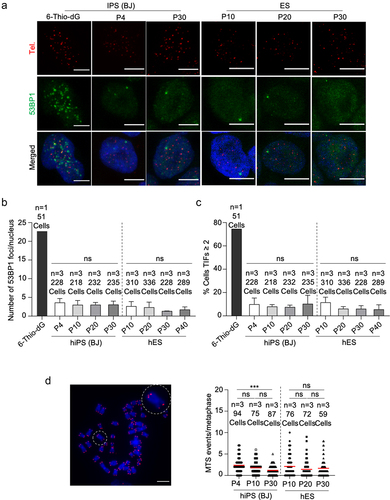
Figure 5. Telomeric chromatin is more “open” and telomeric RNA is upregulated in hiPSCs.
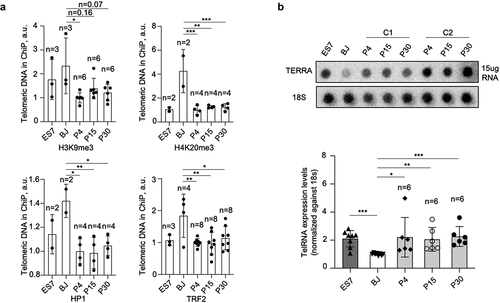
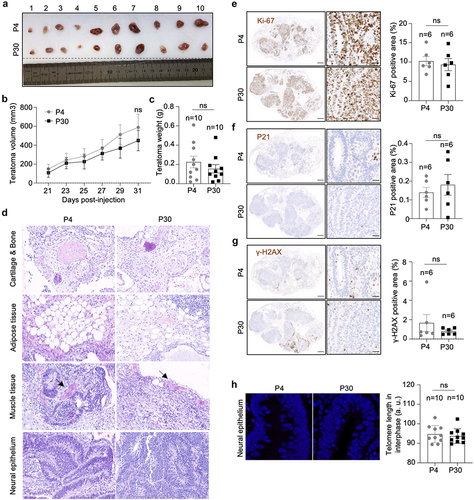
Figure 6. hiPSCs with different telomere length show equal teratoma formation efficiency.
Supplementary figures.pdf
Download PDF (3 MB)Data availability statement
All relevant data are within the manuscript and its Supporting Information files.