
Figures & data
Table 1. Nucleotide sequence of primers used in RT-qPCR.
Figure 1. Examples of melting curves confirming the specificity of the reaction.
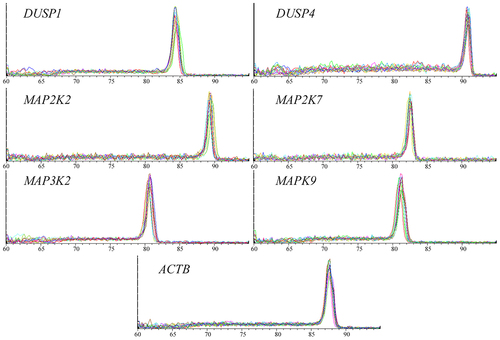
Figure 2. The Venn diagram of microarray results.
Table 2. Expression pattern of MAPK-related genes in the HaCaT cell line exposed to LPS and then cyclosporine for 2, 8, and 24 hours compared to the control (p < 0.05).
Figure 3. Expression profile of mRNA encoding selected MAPK-related genes in HaCaT treated with LPS and then with cyclosporine a for 2, 8, 24 hours compared to the control culture.
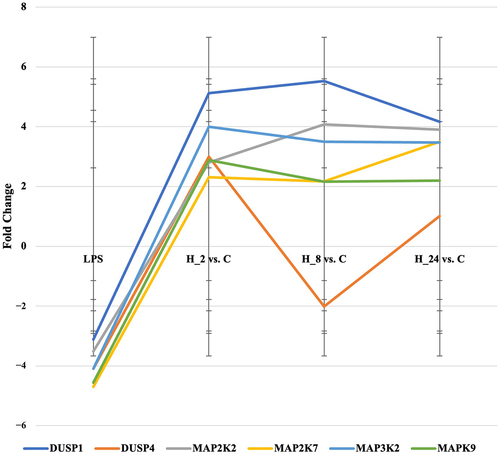
Table 3. Results of ANOVA and Tukey’s post-hoc test for MAPK genes, the expression of which was determined by the qRT-PCR technique.
Figure 4. miRnas potentially modulating the expression of MAP kinase-related genes in keratinocytes exposed to cyclosporine a compared to the control.
Table 4. Expression pattern of miRnas potentially regulating the expression of DUSP1, DUSP4, MAP2K2, MAP2K7, MAP3K2 and MAPK9 of the HaCaT cell line exposed to LPS and then cyclosporine for 2, 8, and 24 hours compared to the control.
Table 5. Concentration of MAP kinase-related genes at the protein level in HaCaT culture exposed to LPS and CsA.
Data availability statement
All data were included in the paper.