Figures & data
Figure 1. Interactions with the LGR5 ectodomain that informed RSPO1 mimetic design. a) Interactions of the cysteine-rich domain of RSPO1 in the Furin-1 region (amino acids 77–113) of LGR5. Surface and ribbon depictions of residues P77-K113 adapted from X-ray crystal structure PDB accession code 4KNG. Important interacting residues R87, F106 and F110 are shown in space filling. b) the structure of the 37 amino acid contrast agent is shown.
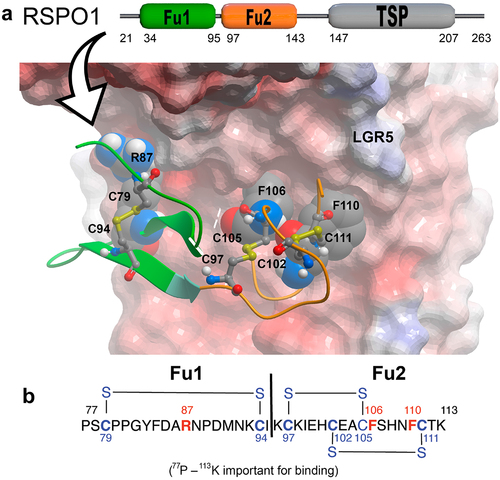
Figure 2. Synthesis of the RPSO1 mimetic constructs. a) Click chemistry was used to join the “left” (RC16) and “right” (RC06/07) side components to form the full-length mimetic peptide, RC18. b) The mutant peptide (RC21) contains the amino acid substitutions shown in red. c) Structure of the Cy5-based fluorescent dyes (sulCy5) used to label the mimetics.
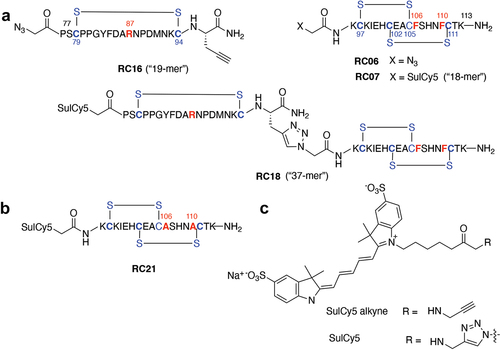
Figure 3. RSPO1 binding assays. a) ELISA data showing dose-response competition of recombinant human RSPO1 binding to human LGR5 coated plates by RC07, RC16 and RC18. b) brightfield (top) and fluorescent (bottom) images of direct binding of the fluorescent RC18 contrast agent to CHO-K1 (LGR5-negative) cells (left) vs. HT29 (LGR5-positive) human colon cancer cells (right). * p < 0.05 (Tukey’s multiple comparisons test).
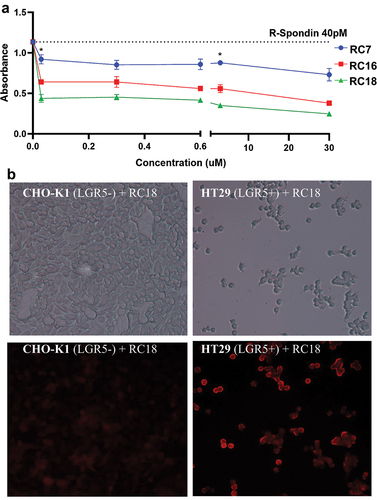
Figure 4. Cell Binding Assays. Confocal microscopy of fluorescent RC18 binding to a) CHO-K1 control vector-transfected cells or b) CHO-K1 cells transfected with LGR5 (CHO-K1-LGR5) and stained with RC18. c) Confocal imaging of CHO-K1-LGR5 stained with an anti-Myc-tag Alexafluor 594 antibody (Ab) d) Binding of RC18 (top) or the RC21 mutant fluorescent peptide containing phenylalanine to alanine mutations (F106A/F110A) (bottom) to CHO-K1 control cells and CHO-K1-LGR5 cells e) Quantification of fluorescence intensity the cells in (D).
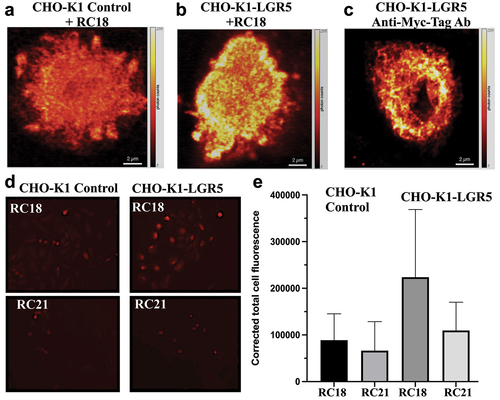
Figure 5. RC18 cell binding in the absence and presence of human recombinant RSPO1. a) Fluorescence microscopy of SW620 CRC cells (top) vs. CHO-K1 (LGR5-) cells (bottom). b). RSPO1 reduced RC18 binding by over 50% in SW620 cells but by less that 2% in the LGR5-negative CHO cells by ImageJ. (*p < 0.05; N = 4).
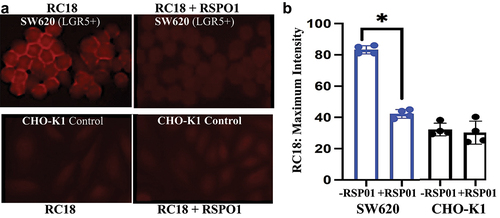
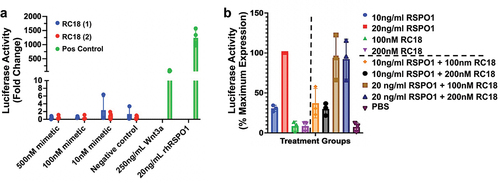
Figure 6. β-catenin signal transduction in HEK293 super TOPFLASH cells. a) Induction of Wnt signaling using two different syntheses of RC18 (mimetic, blue and red bars) vs. recombinant human Wnt3a or recombinant human RSPO 1 (green bars) as positive controls, at the concentrations shown. b). Competition assays with RC18 added to the cells 10 minutes before addition of recombinant human RSPO1 at the concentrations shown. The data are percent maximum activity. Luciferase activity was corrected for protein abundance.