
Figures & data
Figure 1. Total AS in the WBs (million EUR in 2010 prices), 2010–2017
Figure 2. The relationship between the annual change of the total AS and the GDP growth in the WBs, 2010–2017
Figure 3. Development of the market direct producer support in the WBs (index 2010 = 100 in 2010 prices), 2010–2017
Figure 4. Development of structural and rural development support in the WBs (index 2010 = 100 in 2010 prices), 2010–2017
Figure 5. Development of other AS in the WBs (index 2010 = 100 in 2010 prices), 2010–2017
Figure 6. Relative level of total AS in the WBs and the EU (% of agricultural output; EUR/ha), 2017
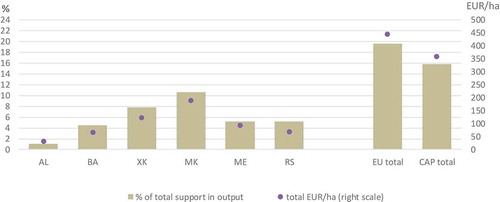
Figure 7. Composition of the total AS in the WBs and the EU (% of agricultural output, EUR/ha, % of total support), 2017
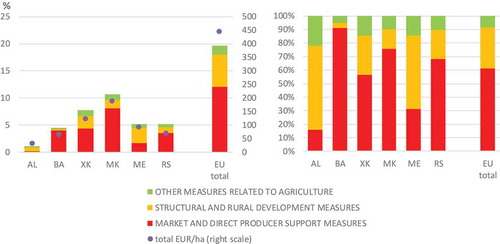
Figure 8. Composition of market and direct producer support in the WBs and the EU (% of agricultural output, EUR/ha, % of first pillar support), 2017
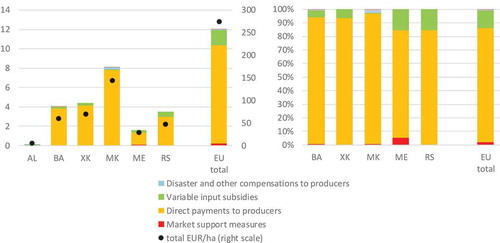
Figure 9. Composition of direct support in the WBs and the EU (% of agricultural output, EUR/ha, % of direct payments), 2017
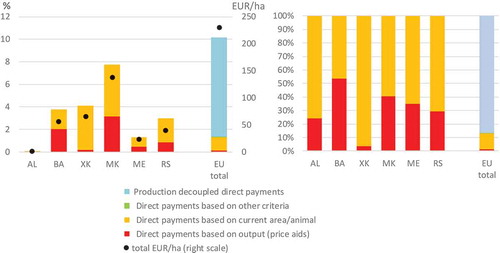
Figure 10. Composition of the structural and rural development support in the WBs and the EU (% of agricultural output, EUR/ha, % of structural and rural development support), 2017
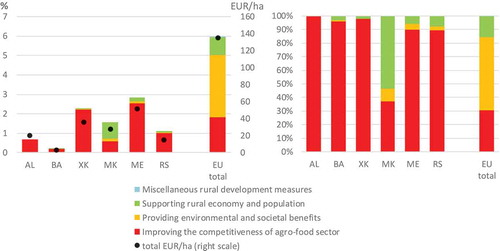
Figure 11. Composition of support for the provision of environmental and societal benefits in the WBs and the EU (% of agricultural output, EUR/ha, % of support for environmental and societal benefits), 2017
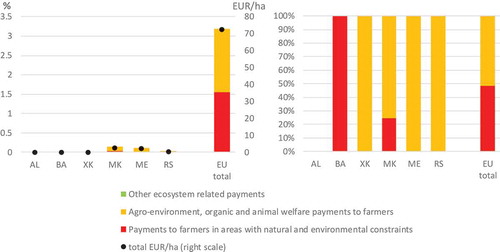
Table 1A. Conceptual framework for assessing the accession and pre-accession agricultural policy harmonization process