
Figures & data
Figure 1. Ecozones (Olson et al. Citation2001), rivers, settlements, and major transport routes in the study area
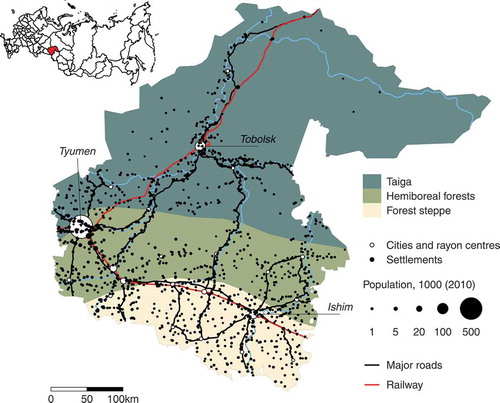
Figure 2. Total population of Tyumen Province, 1981–2018
Figure 3. Patterns of population change in Tyumen Province (the circle size indicates the initial size of the population, while the colors signal changes in population)
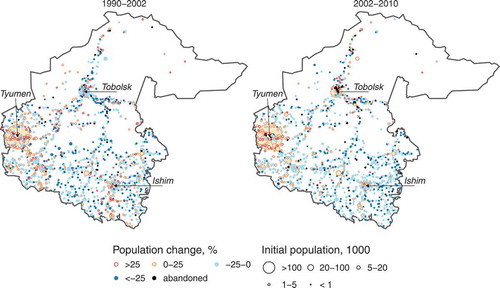
Figure 4. Number of people (a) and share of the working-age population (b) involved in agrarian production in agricultural enterprises and commercially oriented family farms in 2006
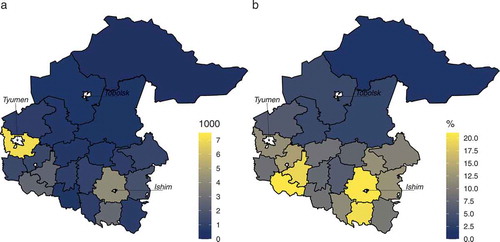
Table 1. Results of the linear mixed-effects model with the percent of the initial population at the end of the period as the dependent variable
Figure 5. Population change in individual settlements plotted as a function of distance to the regional capital
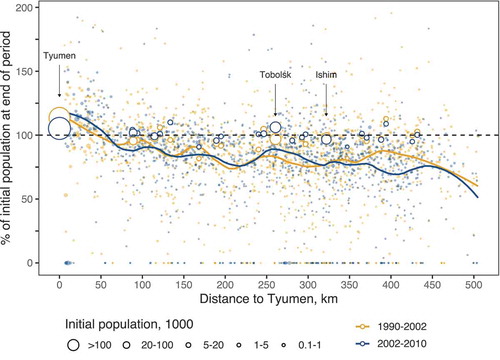
Table A1. Descriptive statistics on variables for the linear mixed effects regression with rayon as a grouping variable
Figure A1. Actual and predicted values (RIRS model) against distance to Tyumen
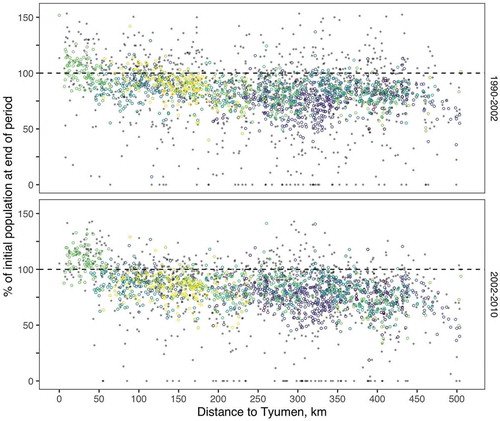
Figure A2.1. Actual and predicted (RIRS model) values against distance to rayon centers
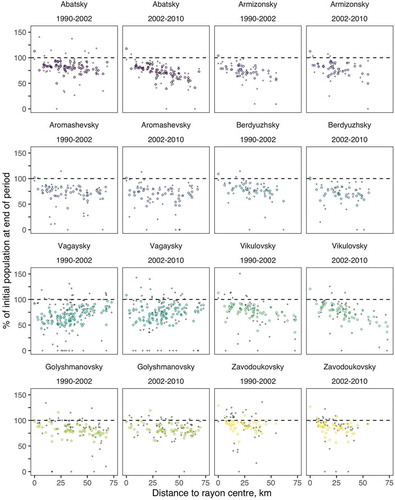
Figure A2.2. Actual and predicted (RIRS model) values against distance to rayon centers
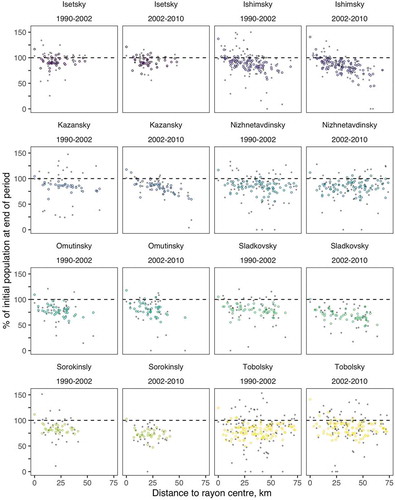
Figure A2.3. Actual and predicted (RIRS model) values against distance to rayon centers
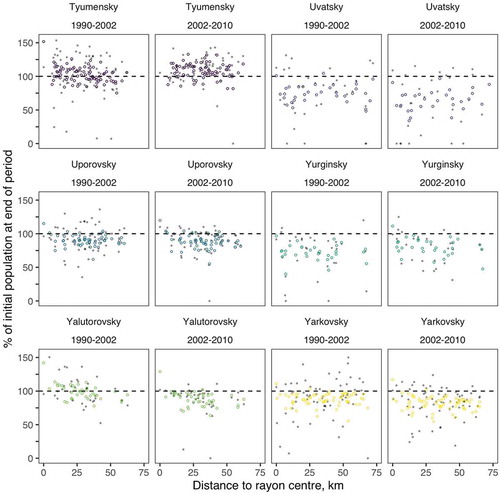
Figure A3. Agricultural dynamics in Tyumen province in 1990–2010
Figure A4. Structural changes in cattle farming in Tyumen province in 1990–2010
