
Figures & data
Figure 1. Change in nighttime luminosity between 1992 and 2012.
Notes: For data see text. Graph computed with QGiS (v.3.8.3) Software
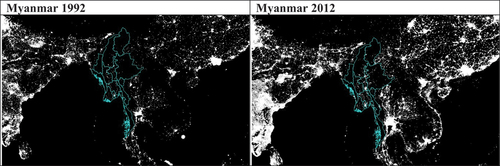
Figure 2. Aid Flows (1995–2015) by Regions.
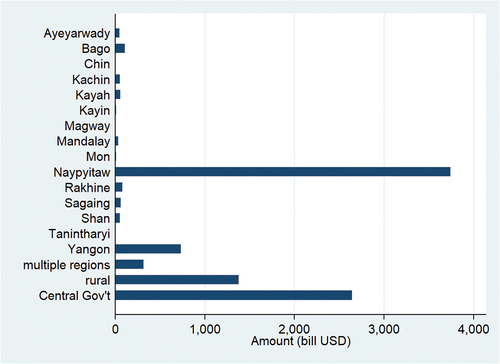
Figure 3. Share of Aid Flows to Regions.
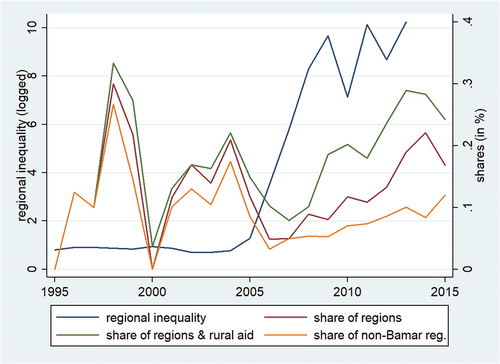
Table A1. Shares for Different Donors.
Table A2. Details About Selected Donors.
Table A3. The correlates of logged nighttime luminosity for 2012.