
Figures & data
Figure 1. Bivariate Moran’s I cluster map of support distribution for SNS (2020) with SNS (2010).
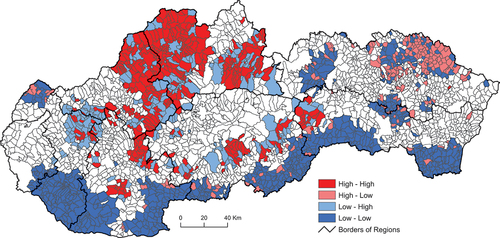
Table 1. Bivariate Moran’s I score for analyzed parties in Slovakia, 2010–2020.
Figure 2. Bivariate Moran’s I cluster map of support distribution for ĽSNS (2020) with ĽSNS (2010).
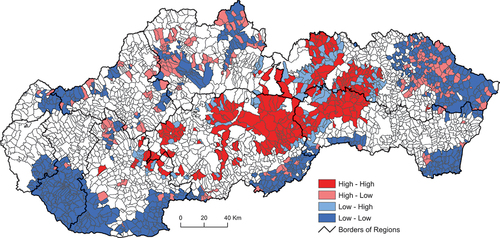
Figure 3. Bivariate Moran’s I cluster map of support distribution for ĽSNS (2020) with SNS (2010).
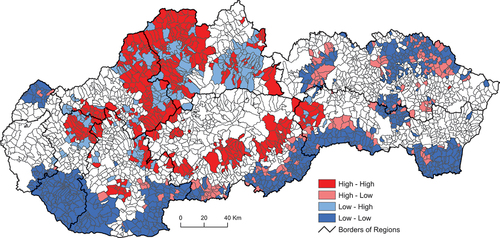
Figure 4. Bivariate Moran’s I cluster map of support distribution for Dawn (2013) with VV (2010).
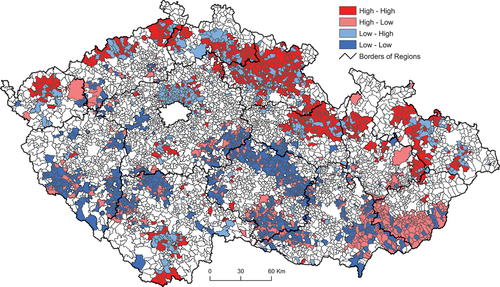
Figure 5. Bivariate Moran’s I cluster map of support distribution for SPD (2017) with Dawn (2013).
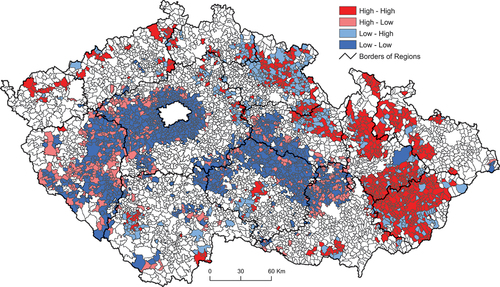
Figure 6. Bivariate Moran’s I cluster map of support distribution for SPD (2021) with DSSS (2010).
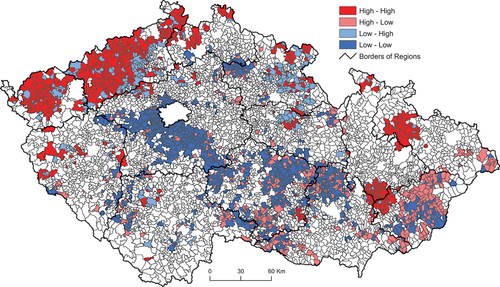
Table 2. Bivariate Moran’s I score for analyzed parties in Czechia, 2010–2021.