
Figures & data
Table 1. Trade between CARs and CIS, 2009–2019%).
Table 2. Trade between CARs and China, 2009–2019%).
Figure 1. Total trade of Tajikistan with the EAEU members, log, 2010–2019.
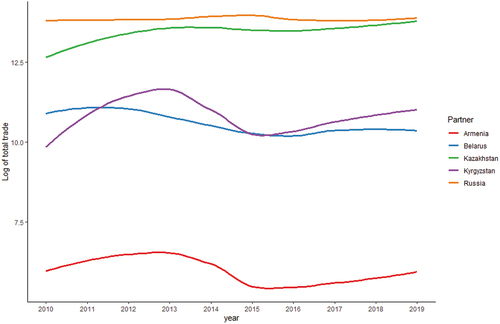
Figure 2. Total trade of Uzbekistan with China, Iran, Russia, and Turkey, log, 2000–2019.
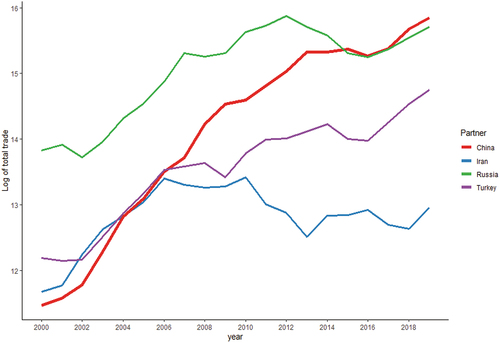
Table 3. Trade between CARs and CU/EAEU, 2010–2019%).
Table 4. Status of WTO accession negotiations.
Table 5. Membership in regional PTA/FTA involving CARs.
Table 6. Applied tariff rate (%) across CARs, all products, 2020.
Table 7. Participation and membership in the related regional organizations and development programs, extended neighborhood.
Figure 3. Total value of SPECA projects focused on trade and transportation, 2008–2019.
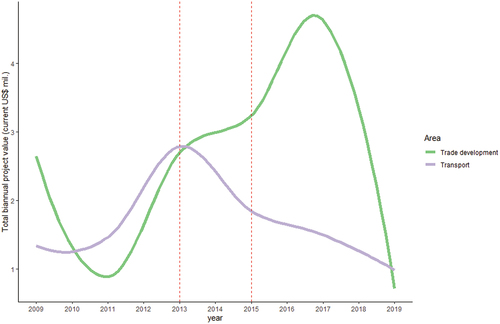
Figure 4. Total value of CAREC funding related to trade development, 2008–2019.
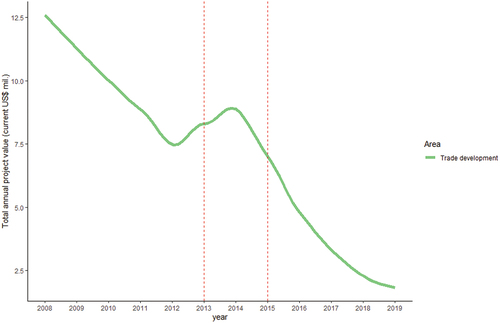
Table 8. Partner sample.
Table 9. Pool of potential integration partners.
Table 10. Variable definitions and data sources.
Table 11. Uzbekistan, 3SLS, bilateral trade, 2010–2019.
Table 12. Tajikistan, 3SLS, bilateral trade, 2010–2019.
Table 13. Alpha estimates for unilateral export and import modes, 3SLS, 2010–2019.
Table 14. Uzbekistan, SUR, bilateral trade, 2010–2019.
Table 15. Tajikistan, SUR, bilateral trade, 2010–2019.