1,790
Views
17
CrossRef citations to date
0
Altmetric
Original Articles

Lower Leg Injury Reference Values and Risk Curves from Survival Analysis for Male and Female Dummies: Meta-analysis of Postmortem Human Subject Tests

, , &
Pages S100-S107 | Received 14 Sep 2014, Accepted 31 Jan 2015, Published online: 01 Jun 2015

Figures & data

Table 1. Summary of data from different groups of studies
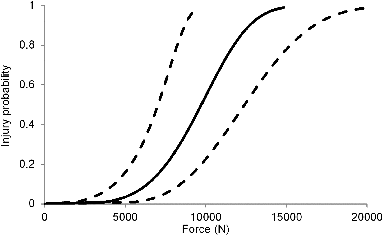
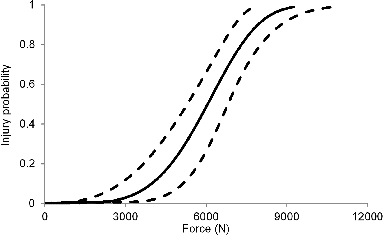
Fig. 1. Injury probability curves for 25 years from PMHS tests. The mean curve is shown as solid and lower and upper 95% confidence intervals are shown as dashed curves.

Table 2. Summary of forces (N) at discrete risk levels for different age groups

Table 3. Quality indices at different injury probability levels
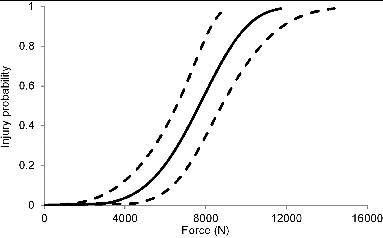
Fig. 2. Injury probability curves for 45 years from PMHS tests. The mean curve is shown as solid and lower and upper 95% confidence intervals are shown as dashed curves.
Fig. 3. Injury probability curves for 65 years from PMHS tests. The mean curve is shown as solid and lower and upper 95% confidence intervals are shown as dashed curves.
Fig. 4. Comparison of mean injury probability curves for 25, 45, and 65 years.
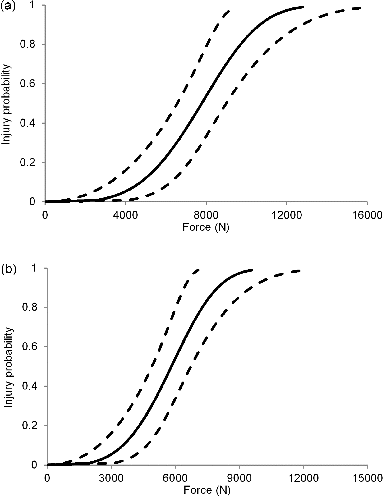
Fig. 5. (5a). Injury probability curves for 45 years corresponding to mid-size male anthropometry. The mean curve is shown as solid and lower and upper 95% confidence intervals are shown as dashed curves. (5b). Injury probability curves for 45 years corresponding to small-size female anthropometry. The mean curve is shown as solid and lower and upper 95% confidence intervals are shown as dashed curves.
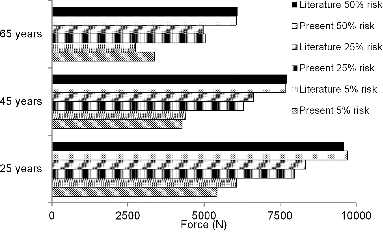
Fig. 6. Bar charts comparing forces (ordinate) at different ages (abscissa) for different risk levels between the present study and literature. Refer to text for details.

Table 4. Forces (N) at different risk level for the 2 dummy anthropometries