Figures & data
Figure 1. Rapid development of human FE models for a diverse population by mesh morphing.
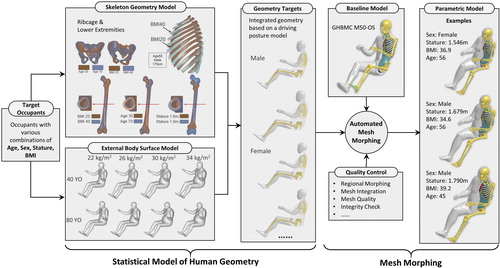
Figure 2. Driving posture model used in this study (Reed et al., Citation2002).
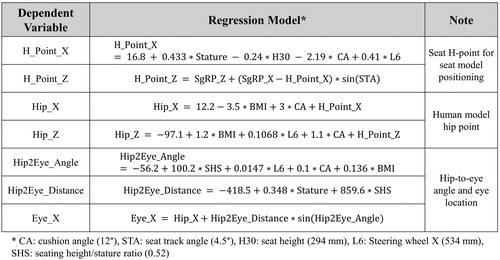
Figure 3. Injury risk curves and scaling method.
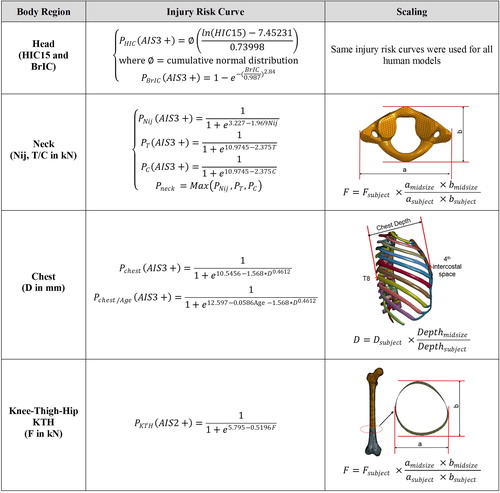
Figure 4. Examples of occupant kinematics in US-NCAP frontal crashes.
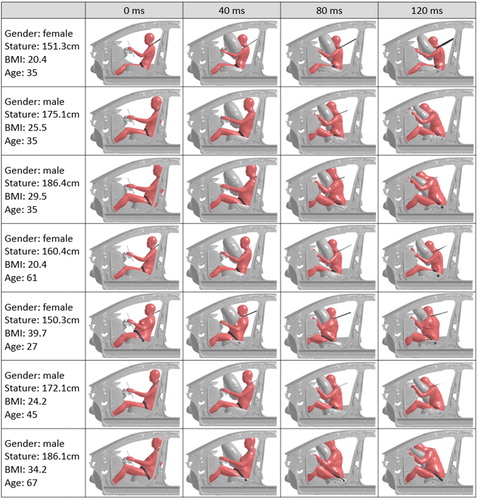
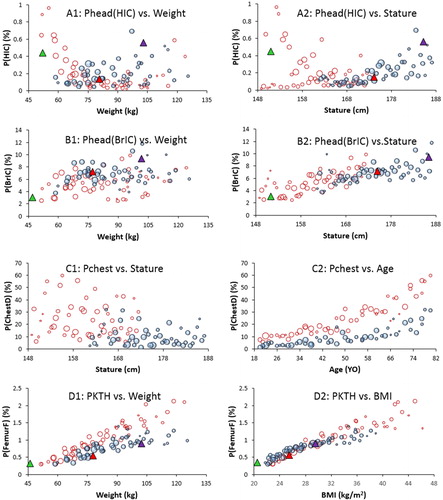
Figure 5. Injury risk distributions with respect to occupant characteristics. Note: The 5th and 50th and 95th are corresponding to the sizes of three adult ATDs, namely small female, midsize male, and large male.