
Figures & data
Table 1. Comparison of pedestrian effectiveness studies conducted in the United States and internationally.
Figure 1. AEB system effectiveness at a range of TTC values and latency values for both the late/hard braking driver scenario and the early/weak braking driver scenario.
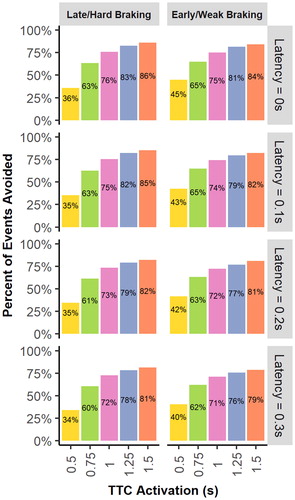
Figure 2. AEB system average change in velocity for unavoided cases for a range of TTC and latency values for both the late/hard braking driver scenario and the early/weak braking driver scenario. The number on the bar corresponds to the number of unavoided cases.
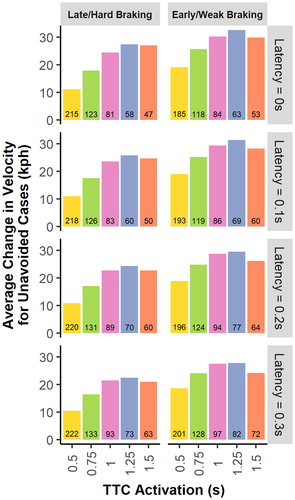
Figure 3. Percentage change in fatality risk for a range of TTC and latency values for both the late/hard braking driver scenario and the early/weak braking driver scenario.
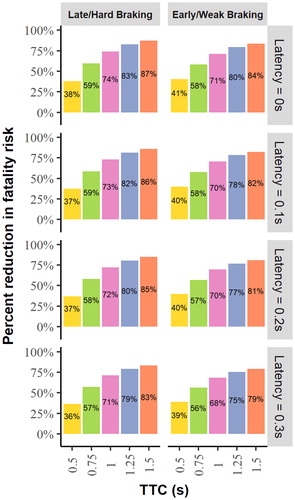
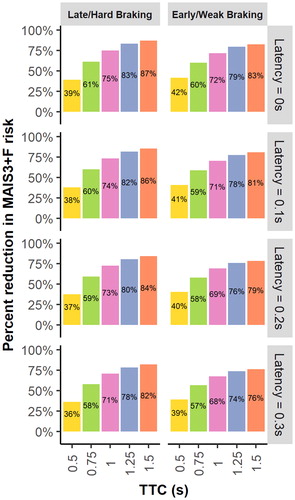
Figure 4. Percentage change in MAIS 3 + F risk for a range of TTC and latency values for both the late/hard braking driver scenario and the early/weak braking driver scenario.
Supplemental Material
Download MS Word (125.8 KB)Data availability statement
The original data sources for this study, PCDS, GES, and FARS, are publicly available from NHTSA. The reconstructions performed for this study are not publicly available.