
Figures & data
Figure 1. PMD accidents show an increasing trend between 2007 and 2016 (based on data from 10 hospital regions).
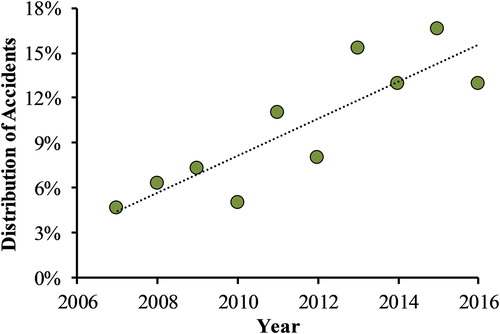
Figure 2. Single accident a) events and b) circumstances.
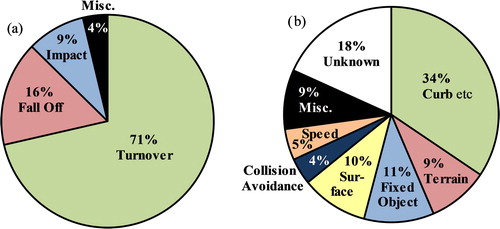
Figure 3. Injury severity in single (red bars) and collision (grey bars) accident events.
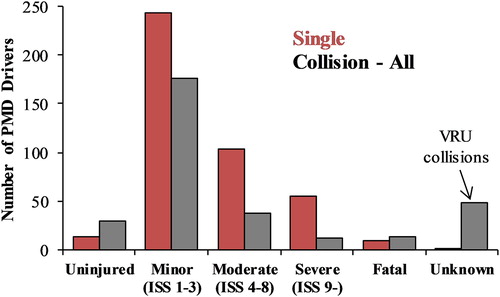
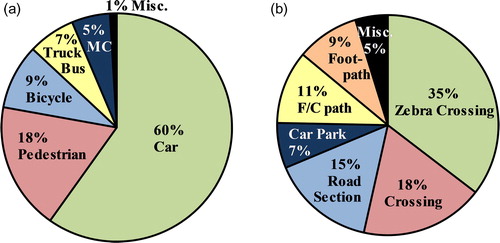
Figure 4. Collision accident (a) events and (b) circumstances. MD = motorcycle; F/C = combined foot path and cycle lane.
Supplemental material