
Figures & data
Figure 1. The chain of events leading up to a crash. From Rizzi (Citation2016). Reprinted with permission.
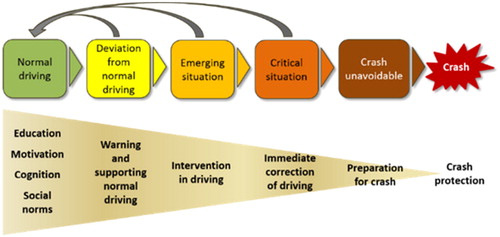
Table 1. Distribution of fatalities per vehicle type.
Table 2. Distribution of fatalities by accident type.
Table 3. Overview of possible interventions to prevent fatalities.
Figure 2. Estimate of the future development of fatal injuries among bicyclists on rural and urban roads as an effect of the implementation of vehicle safety technologies listed in the Appendix. Dotted lines = fast implementation rate; solid lines = expected implementation rate.
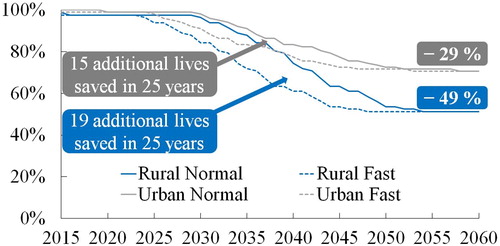
Table 4. Potentials of infrastructure interventions to prevent fatalities.
Supplemental material