
Figures & data
Figure 1. A diagram of the LTAP/OD crash mode. The red car is the traveling-through vehicle and the blue car is the turning vehicle.
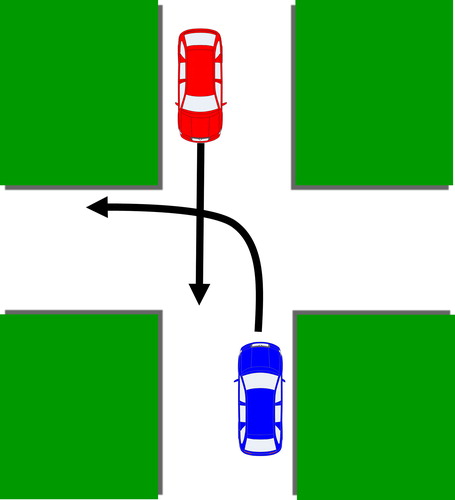
Figure 2. I-ADAS crash reduction effectiveness for the case where one vehicle was equipped with I-ADAS. Each point represents a unique threshold latency–system design–sightline assumption. The star-and-diamond shape indicates several latency values overlaid on top of one another. “Best” and “worst” refer to the best-case and worst-case sightline assumptions, respectively.
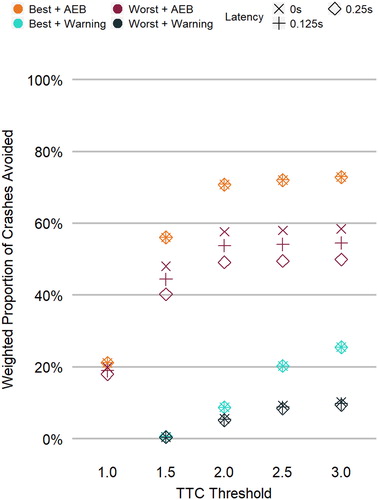
Figure 3. I-ADAS crash reduction effectiveness for the case where both vehicles were equipped with I-ADAS. Each point represents a unique threshold latency–system design–sightline assumption. The star-and-diamond shape indicates several latency values overlaid on top of one another. “Best” and “worst” refer to the best-case and worst-case sightline assumptions, respectively.
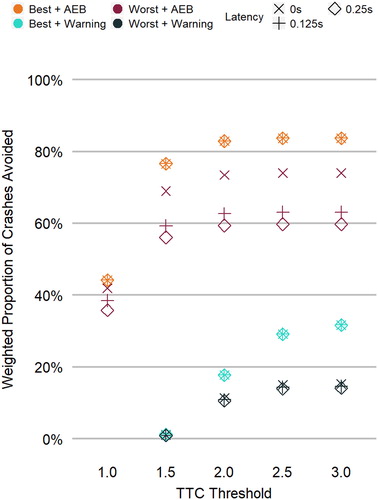
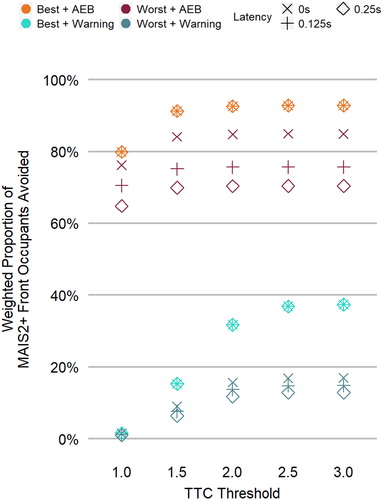
Figure 4. I-ADAS injured person reduction effectiveness for the case where one vehicle was equipped with I-ADAS. Each point represents a unique threshold latency–system design–sightline assumption. The star-and-diamond shape indicates several latency values overlaid on top of one another. “Best” and “worst” refer to the best-case and worst-case sightline assumptions, respectively.
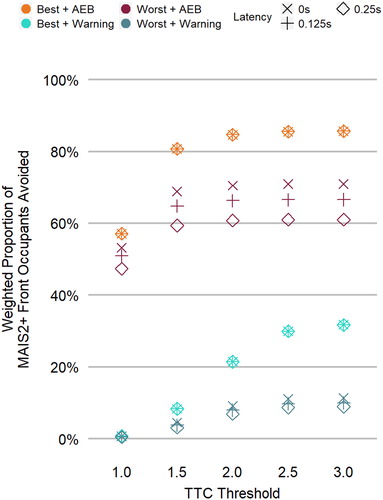
Figure 5. I-ADAS injured person reduction effectiveness for the case where both vehicles were equipped with I-ADAS. Each point represents a unique threshold latency–system design–sightline assumption. The star-and-diamond shape indicates several latency values overlaid on top of one another. “Best” and “worst” refer to the best-case and worst-case sightline assumptions, respectively.
Supplemental Material
Download MS Word (921.6 KB)Data availability statement
The original data source for this study, NMVCCS, is publicly available from NHTSA. The reconstructions performed for this study are not publicly available.