Figures & data
Figure 1. Simplified flow diagram of the investigated safety system.
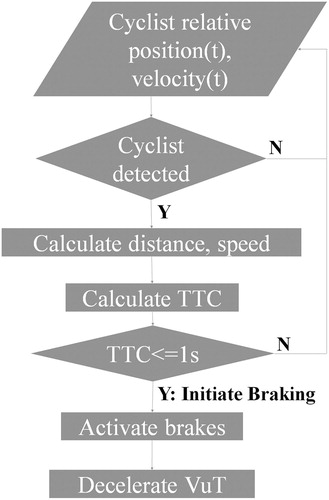
Table 1. Percentage of test cases where all participants had same results (either true for all events cyclist detected, algorithm fired, and collision avoided).
Table 2. Minimal, maximal, mean, median and range values of detection rate, firing rate, avoidance rate and average speed reduction for all sensor setups and participants.
Table 3. Minimal, maximal, and range (maximum-minimum) values of the results of the flow of actions–based analysis. “Firing” relates to the moment where TTC falls below the threshold.
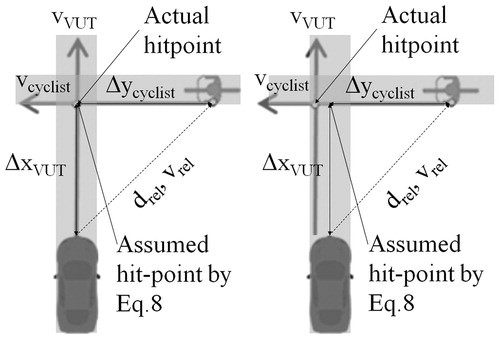
Figure 2. Variable definitions used for different TTC calculation methods. The left side shows a collision configuration with the hit-point in the middle of the car. The right side shows a collision configuration with a lateral offset between hit-point and middle of the car, where (Eq. 8) underestimates the TTC.