
Figures & data
Figure 1. NADS-1 simulator: (a) dome exterior, (b) dome interior, (c) DMS location, and (d) DMS camera view.
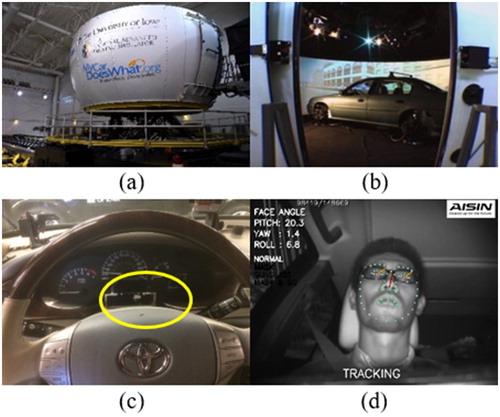
Table 1. Model performance statistics with test set.
Figure 2. Distribution of ORD ratings among possible values (0–4).
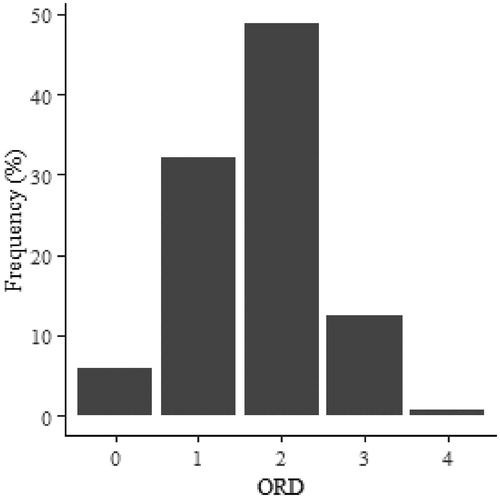
Figure 3. ROC curve for binary model.
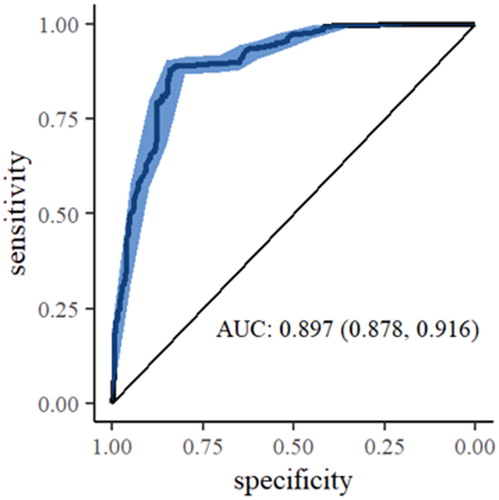
Table 2. Three-class model confusion matrix for prediction of ORDs.
Supplemental material