
Figures & data
Figure 1. Cyclist crossing scenario. The distance d represents the moment the cyclist becomes visible until the cyclist reaches the intersecting point with the car. For the present study, the distance d was 17 m.
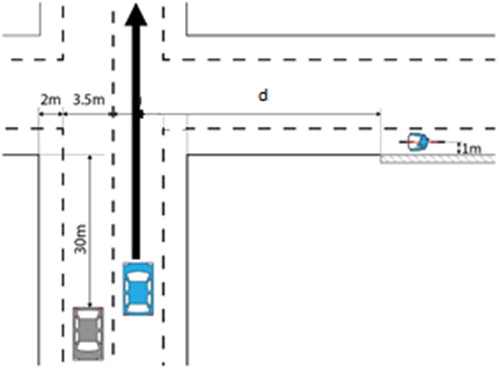
Figure 2. Comfort boundary model developed by Boda et al. (Citation2018). The study was conducted in a simulator on a test track. It was concluded that brake onset depends on the time the cyclist becomes visible (TTAvisibility).
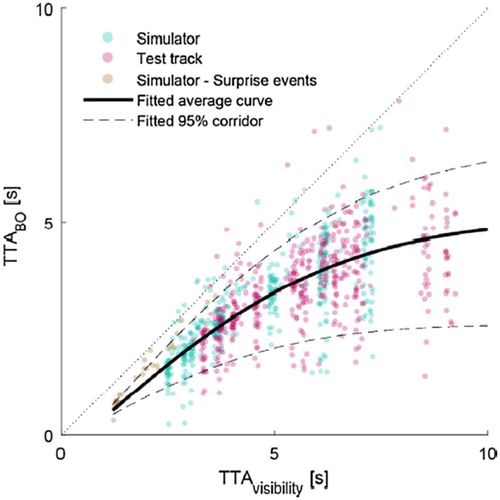
Figure 3. Simulated scenario used based on the AUDI AG test track.
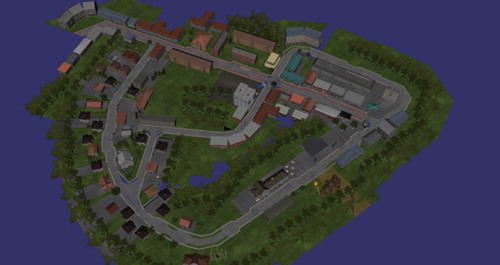
Figure 4. Vehicle-in-the-loop system. Participants drive a real car that is fitted with screens on which a simulated environment is projected.
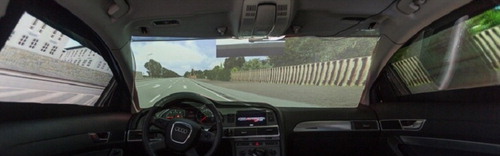
Figure 5. Time gap between the warning time and brake onset for both groups (inside and outside the CB). The box plots show the mean and standard error of the mean.
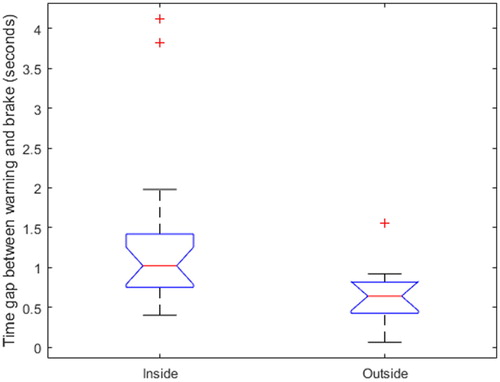
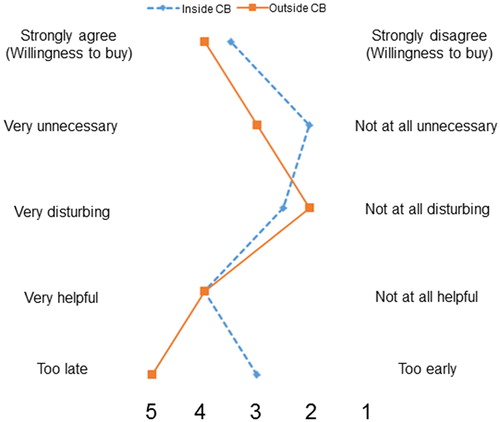
Figure 6. Answers given by participants in both groups (inside and outside the CB). The plot shows the mean values for each group for each of the 5 questions asked during the poststudy survey. The survey used a 5-point Likert scale.
Supplemental Material
Download MS Word (33.5 KB)Data availability statement
The data that support the findings of this study are available on request from the corresponding author (PPG). The data are not publicly available due to a confidentiality agreement between the partners of the PROSPECT project.