
Figures & data
Table 1. Experimental design including increasing levels of technology penetration.
Table 2. Summary of simulation results including number of crashes, crash rates, and relative crash rates for each level of technology penetration level simulated.
Figure 1. Comparison of relative crash rates by AD penetration level.
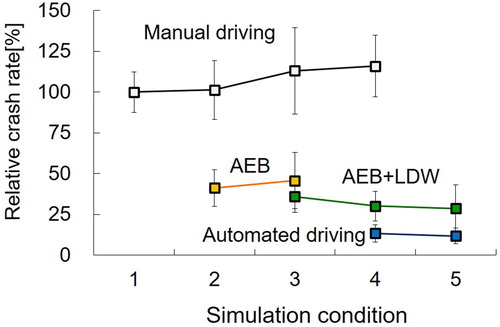
Figure 2. Comparison of relative crash rates and component rates.
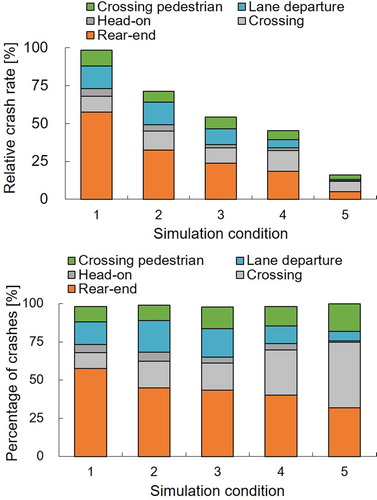
Figure 3. Average and relative crash speeds in rear-end V2V crashes for all scenarios simulated (1–5).
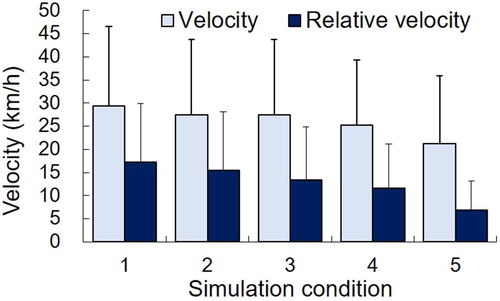
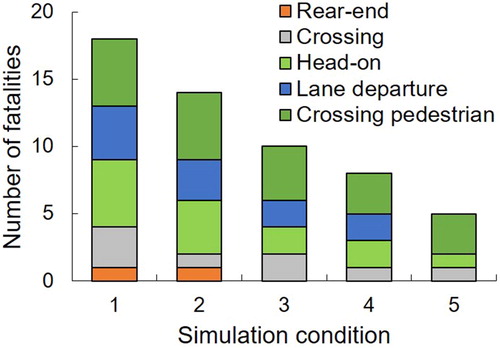
Figure 4. Estimated number of fatalities for all scenarios simulated (1–5).
Supplemental material