
Figures & data
Table 1. Mean (SD) of participants’ age, height, and weight.
Figure 1. Mean (SD) of AEB (right) and MEB (left) vehicle acceleration used in this study. The steady-state phase was defined for each trial and was based on the vehicle acceleration profile. The 2 dashed lines define the boundaries of the steady-state phase ad the black line represents the onset of the maneuver (i.e., maneuver start).
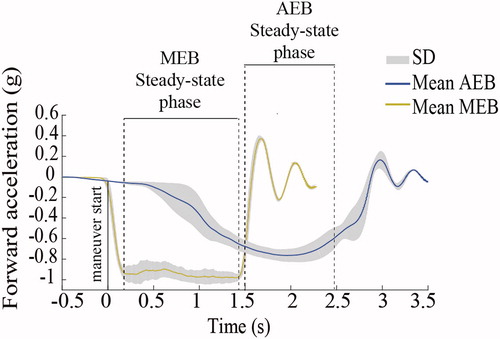
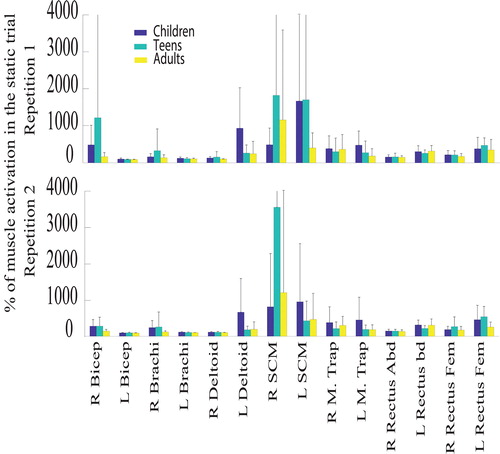
Figure 2. Mean (SD) of EMG represented as a percentage of muscle activation in the static trial of mean EMG in repetition 1 (top graphs) and repetition 2 (bottom graphs) in MEB.
Supplemental material