
Figures & data
Figure 1. Partner death rate of SUVs and pickups relative to partner death rate of cars, 1989–2016.
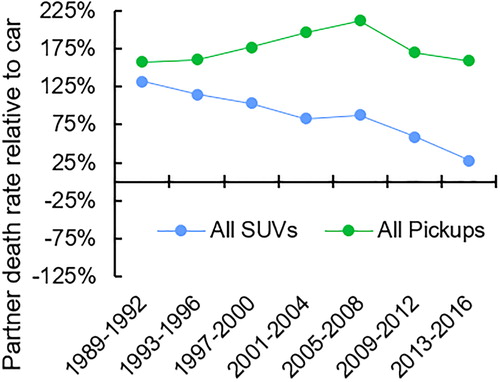
Figure 2. Average curb weight ratio between case and car partner vehicles, 1989–2016.
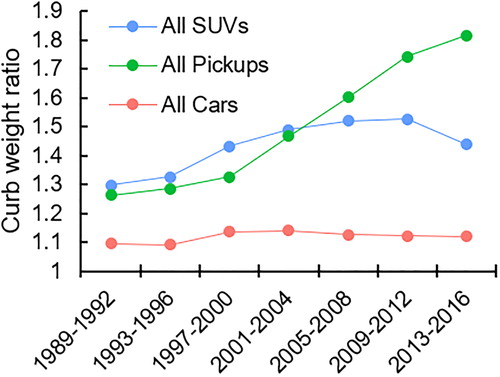
Figure 3. Partner death rate of 3,500- to 4,000-pound SUVs and pickups relative to partner death rate of similar-weight cars, 1989–2016. Solid lines represent the same effect for the whole sample (i.e., data from ).
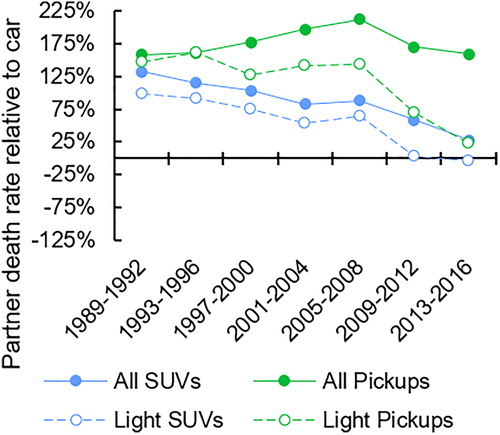
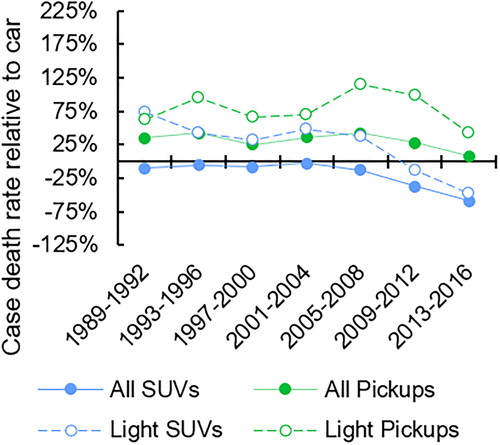
Figure 4. Case death rate for SUVs and pickups relative to that for cars, 1989–2016.
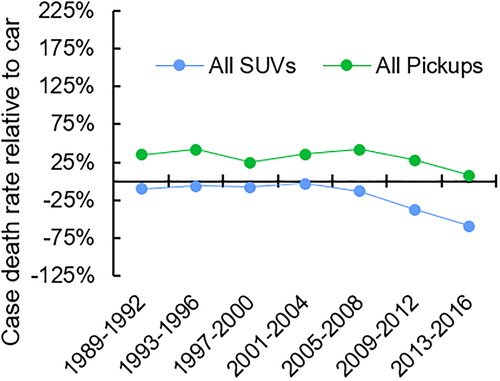
Figure 5. Case death rate for 3,500- to 4,000-pound SUVs and pickups relative to that for similar-weight cars, 1989–2016. Solid lines represent the same effect for the whole sample (i.e., data from ).
Supplemental material